Airbnb data is the world’s biggest and fastest growing accommodation-sharing portal operating in 65,000 cities across 90 countries. Hence, it’s not surprising that they have established their presence in all the United States! One of the smallest yet most popular states for vacations is ‘Vermont’, owing to miles of rolling forests flush with flora and fauna, scenic mountains and a lake marking its border with New York. Thus, there exists a natural synergy between this state and Airbnb.
We, as a web data extraction company, crawl and extract airbnb data for many of our clients in the travel space. In this study, we’ve taken the data for ‘Vermont’ to perform some interesting analyses with respect to pricing.
Goals
We’ll start with exploratory analysis and then move to spatial mapping. Given below are the goals of this study:
- Average rate of the properties over the years
- Distribution of property prices
- Average price per room for properties with different number of bedrooms
- Density mapping of properties
- Heat map of properties with respect to prices
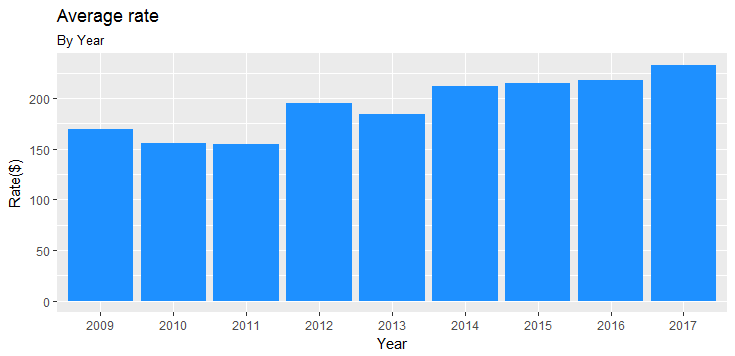
Let’s first find out how the property prices have changed based on date of listing. Here is the chart showing the average rate from 2008 to 2017.

We have removed the properties for 2008 as the numbers were very less in comparison to the subsequent years. Here we see that the rate has been constantly increasing airbnb data from 2012 barring 2013 and there is a decline in rate from 2009 to 2011. The average rate for 2017 stands at $232.
Now let’s check out the common pricing range of the properties in terms of average rate per night.
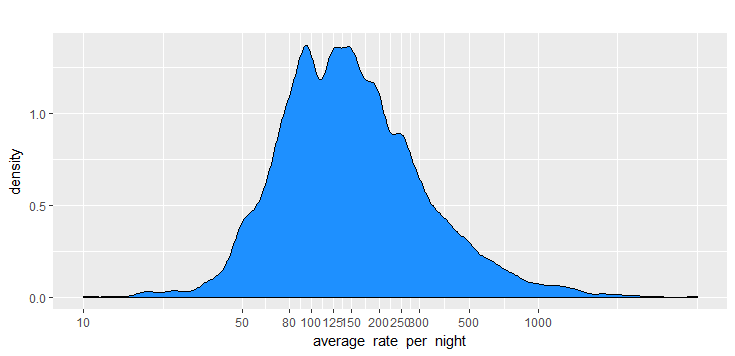 We can see that the most frequently used pricing ranges are $90-$100 and $125-150. The average rate for all the properties lies at $206.
While searching for properties, what type of properties should you search to get the best per room price? In other words, we will find out the properties that are most economical in terms of the number of rooms. For this, we’ll calculate the average rate of properties belonging to different categories based on bedroom numbers and derive the per room pricing. Here is the chart:
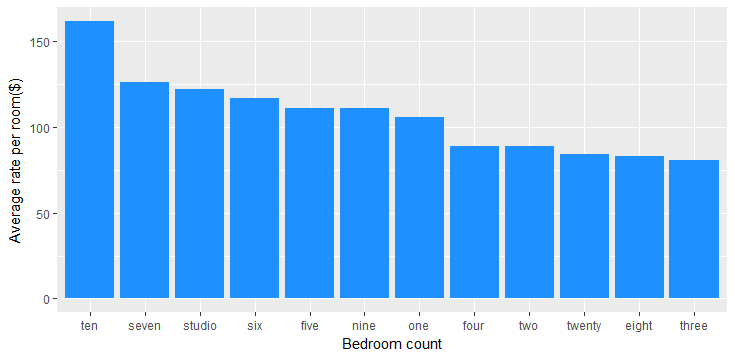
We can see that the average rate per room for a 10 bedroom property is highest at $162 and lowest for three-bedroom property at $81.
Spatial Mapping
Now, we’ll move to spatial mapping in which first we’ll plot property concentration in various locations of Vermont. We do this by downloading Google map and plotting density estimation by contours using longitude & latitude. Here is the result:
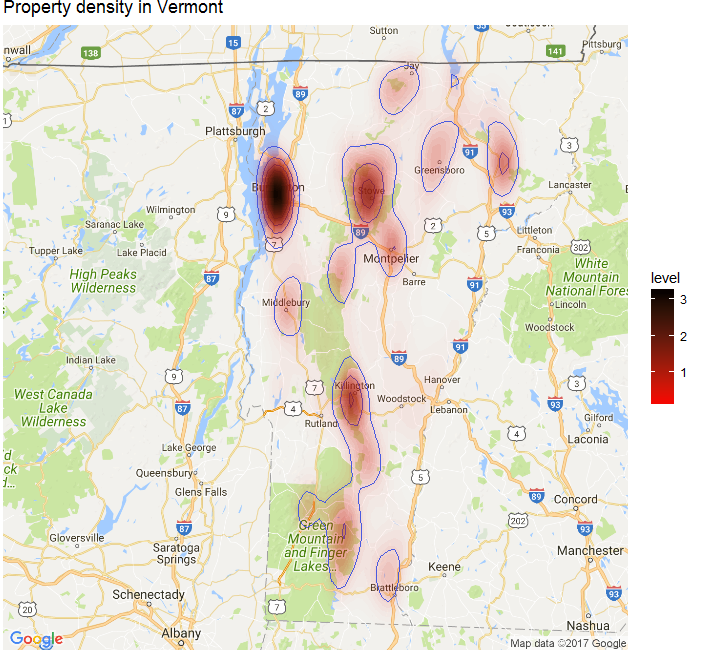
The black color depicts highest and red depicts lowest density. We can see that the highest concentration of the properties lies near ‘Burlington’ city, which is closer to the border of the state. Other notable areas are ‘Stowe’, ‘Killington’, ‘Burke’ and ‘Green Mountain and Finger Lakes National Forests’. As expected, most of these property clusters are situated near forest areas and mountains.
Now let’s figure out the areas which are expensive relative to other areas of the state. Here is the visualization:
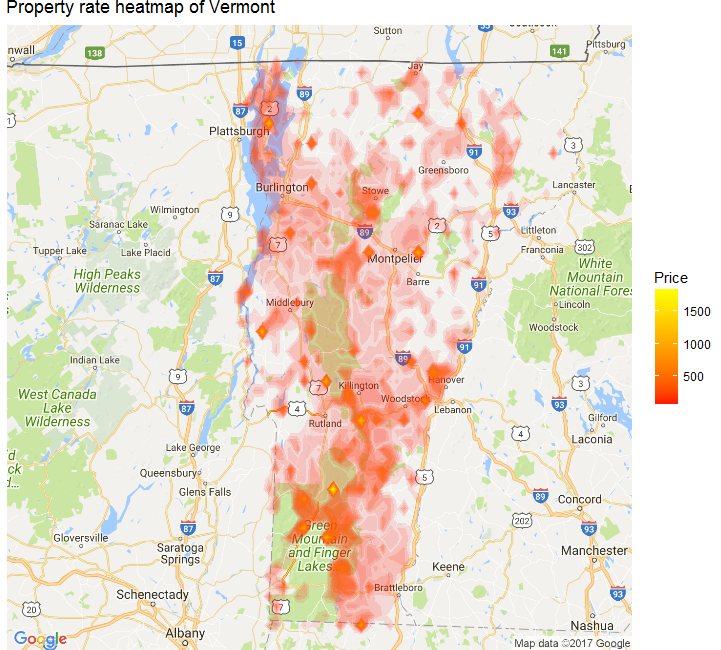
The red to yellow color transformation shows the increase in price. We can see that the expensive properties are in ‘Green Mountain and Finger Lakes National Forests’, ‘Bridgewater’, ‘Montpelier’, etc.
Conlusion
In this study, we found that the average property rate has been increasing since the last five years and this year the price is at $232. We also uncovered the most frequently used rate lies in between $90 and $150 with the average property rate at $206. The most economical rate per room comes with 3 bedroom apartments, while 10 bedroom apartments command the highest rate per room. Finally, we moved on to spatial mapping to visualize the property density and the pricing heatmap.
Note: R, ggplot2 and ggmap were used to create these visualizations.