Why web scraping monitoring breaks at the data layer
Most teams believe they have web scraping monitoring under control because the infrastructure looks stable. The crawler ran, the job completed, retries were handled, and the status dashboard shows green. On paper, everything worked.
The problem is that infrastructure success does not guarantee data correctness. A scraping job can finish successfully while returning incomplete records, missing fields, stale prices, or partially captured listings because of subtle layout changes. Pagination can shift. A selector can degrade. A site can begin serving alternate markup to certain IP ranges. None of this necessarily triggers a system-level failure.
This is where the gap between web scraping monitoring and web scraping observability becomes visible. Monitoring answers whether the job ran. Observability answers whether the data still reflects reality. If you are not measuring scraping performance metrics, failure detection at the field level, schema drift detection, and data freshness monitoring, you are operating blind.
The result is not dramatic outages. It is silent degradation. And silent degradation is what erodes trust in data systems.
In production scraping systems we manage, infrastructure failures are typically detected within minutes. Field-level completeness failures, when not actively monitored, are discovered on average 3–5 days later through downstream reporting discrepancies.
Let’s walk through the ten challenges that make web scraping monitoring far more complex than most teams anticipate.
Many organizations begin web scraping with internal scripts, but maintaining crawler infrastructure, handling anti-bot protections, and monitoring data quality quickly becomes a full-time operational task.
Challenge 1: Job-Level Monitoring Creates a False Sense of Safety
What job-level monitoring actually tells you
Most web scraping monitoring starts with the job layer because it is measurable. You see whether the crawler ran, how long it took, retry counts, proxy failures, and whether the process exited cleanly. That is useful for uptime, cost control, and capacity planning.
What it misses entirely
Job success is not data success. A scrape can finish “successfully” while the dataset is unusable. Common blind spots:
- Record count drops: pagination changes, hidden infinite scroll, category routing changes.
- Field completeness decay: selectors still match, but values are empty, truncated, or shifted.
- Wrong data mapped to the right fields: title captured as price, currency captured as rating, etc.
- Partial coverage: some geos, filters, or variants fail, but the job still completes.
- Freshness drift: the pipeline runs on time but captures cached or delayed content.
The operational failure mode
The worst part is that nothing screams. Your crawl health dashboard shows green because the system did what it was told. Meanwhile, downstream teams see business metrics wobble and spend days debating whether the dashboard is wrong or the business is changing.
This is how alert fatigue starts. Your team gets conditioned to trust “job success,” and when data issues surface, they are discovered through customer complaints, analyst questions, or model degradation instead of pipeline alerts.
What web scraping observability needs here
To reduce delayed detection, you need outcome signals that sit above the job:
- Expected volume checks: records per run, per category, per geo compared to baseline.
- Field-level completeness: null rate, empty string rate, missing field rate.
- Distribution drift: sudden shifts in price ranges, rating counts, or category mix.
- Coverage metrics: percent of URLs attempted vs captured vs valid.
- Data reliability metrics: pass rate for validation rules, not just process exit code.
If you are only monitoring whether the crawler ran, you are monitoring the machine. Web scraping monitoring has to include whether the data still represents reality.
Challenge 2: Monitoring Infrastructure, Ignoring Data Quality
Why infrastructure signals feel “safe”
Most teams build web scraping monitoring around what they can observe without touching the dataset: request success rates, response codes, latency, proxy health, and queue backlogs. These are good scraping performance metrics, but they only prove the pipeline is moving.
The data-quality failures that slip through
When monitoring ignores the data layer, you miss the failures that actually hurt decisioning:
- Stale outputs: the job runs, but the content is cached, delayed, or unchanged beyond your freshness SLA.
- Silent truncation: a page loads partially, the scraper extracts only the first block, and you still get “valid” rows.
- Selector degradation: fields exist but are captured as blanks or defaults, so error logging stays quiet.
- Schema drift: new fields appear, old fields move, or types shift (number → string). Downstream transforms keep running, but logic breaks.
- Duplicate inflation: the job loops wrong or retries are written twice, causing record counts to look healthy while uniqueness collapses.
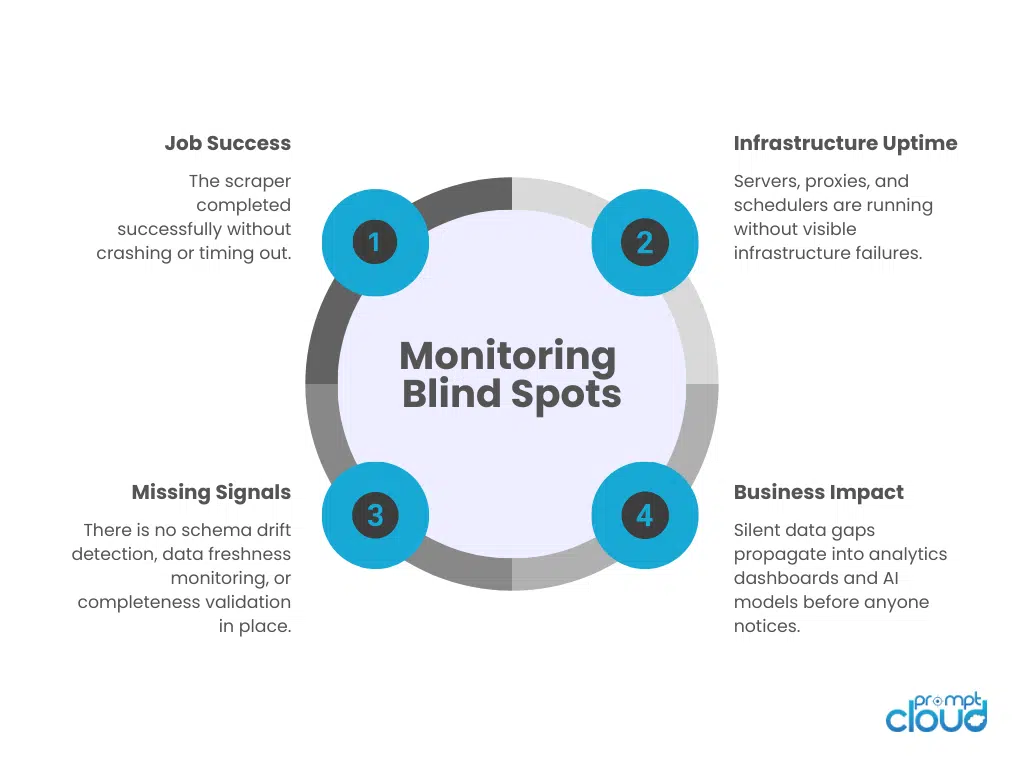
Figure 1: Comparison of job-level monitoring versus full web scraping observability including data-level validation.
What to monitor at the data layer
Web scraping observability needs dataset checks that are cheap, consistent, and enforced every run:
- Completeness: null rate per field, percent of rows with required fields present.
- Validity: range checks (price > 0), pattern checks (currency format), type checks.
- Uniqueness: duplicate rate by primary key or canonical URL.
- Freshness: last-seen timestamps, change rate, freshness buckets for SLA tracking.
- Drift: distribution shifts for key fields, schema drift detection on columns and types.
Challenge 3: Alert Fatigue Makes Teams Ignore the Only Signals They Have
Too many alerts, too little signal
Once teams realize infrastructure-only monitoring is not enough, the usual reaction is to add more alerts. Response code thresholds. Retry spikes. Latency variance. Queue backlogs. Field-level null thresholds. Freshness breaches. Soon, the system generates dozens of pipeline alerts per day.
The intention is good. The outcome is noise.
When web scraping monitoring produces constant warnings, engineers stop treating alerts as urgent signals. They become background notifications. Slack channels fill up. Email digests are muted. The team assumes most alerts are transient and will auto-resolve.
That is how real failures slip through.
Why scraping systems generate noisy signals
Scraping environments are inherently unstable. Websites change frequently. Anti-bot defenses fluctuate. Traffic patterns shift. A strict threshold-based failure detection system triggers alerts for temporary volatility, even when the system self-recovers.
Common sources of noisy alerts:
- Minor record-count fluctuations that are seasonally normal
- Temporary proxy bans that retry successfully
- Small freshness delays during peak hours
- Slight schema changes that do not affect required fields
Without context, these are indistinguishable from critical failures.
The structural flaw in alert design
Most alerting systems treat every deviation as equally important. They do not classify alerts by business impact. A 5 percent drop in record count triggers the same urgency as a 60 percent coverage collapse. A non-critical field missing triggers the same noise as a required pricing field breaking.
This is not a tooling issue. It is an observability design issue.
What disciplined web scraping observability looks like
To avoid alert fatigue while improving failure detection, teams need layered alerting:
- Tiered severity levels tied to business impact
- Baseline-aware anomaly detection, not static thresholds
- Grouped alerts, so multiple field failures surface as one incident
- SLA tracking dashboards that show trend drift instead of single-run panic
- Actionable alerts, where each alert maps to a defined remediation path
Challenge 4: Delayed Detection of Silent Data Degradation
The most expensive failures don’t crash
In web scraping monitoring, the obvious failures are rarely the damaging ones. A crawler crash gets noticed immediately. A proxy pool failure spikes errors. Those are loud events.
The dangerous failures are quiet. Record counts decline gradually over weeks. A required field slowly shifts from structured values to mixed formats. A category starts returning partial listings because pagination logic changed. The system continues to run. The crawl health dashboard stays green. No pipeline alerts fire.
By the time someone notices, downstream analytics or AI models have already been influenced by degraded data.
Why detection gets delayed
Silent degradation is hard to catch because most systems monitor point-in-time metrics. They check whether this run passed validation rules. They do not compare trends across time.
Common gaps include:
- No historical baseline comparison for scraping performance metrics
- No rolling analysis of null-rate changes
- No anomaly detection on distribution shifts
- No trend tracking on freshness windows
Without trend context, gradual decay looks normal.
The compounding impact
Delayed detection creates a layered problem. Analysts question dashboards. Product teams question decisions. ML models adapt to flawed inputs. Trust erodes. And because the degradation was gradual, root cause analysis became complex. You do not know exactly when the break started.
What effective detection requires
Web scraping observability must include time-series awareness:
- Rolling baselines for record counts per source and category
- Trend-based anomaly detection, not static thresholds
- Drift detection for field distributions over defined windows
- Data reliability metrics tracked longitudinally, not per run
Experiencing These Challenges?
Many organizations begin web scraping with internal scripts, but maintaining crawler infrastructure, handling anti-bot protections, and monitoring data quality quickly becomes a full-time operational task.
Challenge 5: No Clear Ownership Between Data and Engineering Teams
The accountability gap
Web scraping monitoring often breaks down not because of tooling, but because of ownership ambiguity. Engineering teams monitor uptime, infrastructure, and crawler stability. Data teams monitor analytics, dashboards, and downstream models. The scraping layer sits in between.
When something goes wrong, everyone sees the symptom, but no one owns the signal.
If a crawl fails completely, engineering responds. If a dashboard looks incorrect, analytics investigates. But if record counts slowly decline, freshness windows drift, or schema drift detection flags a subtle type change, responsibility becomes unclear. Is it a scraper issue? A transformation issue? A modeling issue?
Without defined ownership, failure detection gets delayed because teams assume someone else is watching.
How this affects observability
Web scraping observability requires alignment across layers:
- Infrastructure signals owned by platform engineering
- Data validation and schema checks owned by data engineering
- Business SLA tracking owned by stakeholders who consume the data
If these are not explicitly assigned, monitoring becomes fragmented. Each team builds partial visibility, but no one has end-to-end observability.
The structural mistake
Many organizations treat scraping as a utility rather than a data product. When scraping is seen as a background process, monitoring is limited to uptime. When it is treated as a product feeding decision systems, it requires defined SLAs, structured error logging, and accountable owners for freshness, completeness, and reliability.
What strong ownership looks like
Clear ownership in web scraping monitoring means:
- Defined data SLAs with named accountable leads
- A unified crawl health dashboard that surfaces both system and data metrics
- Incident classification that distinguishes infrastructure vs dataset issues
- Cross-functional reviews of recurring pipeline alerts
Challenge 6: Lack of Baselines for Scraping Performance Metrics
You cannot detect drift without a reference point
A common weakness in web scraping monitoring is the absence of defined baselines. Teams track raw numbers: records per run, error rates, latency, freshness lag. But they rarely define what “normal” looks like.
If yesterday produced 120,000 records and today produces 105,000, is that a failure? Maybe. Or maybe it is seasonal demand, a weekend drop, or inventory fluctuation.
Without historical baselines segmented by source, category, geography, and time window, every metric becomes ambiguous.
Where baseline gaps show up
Baseline blindness affects multiple areas:
- Record volume: no expected range per source or segment
- Field completeness: no historical null-rate benchmarks
- Change frequency: no expected update cadence for dynamic fields
- Freshness windows: no defined SLA per dataset
- Duplicate rates: no acceptable tolerance thresholds
Without these anchors, anomaly detection becomes guesswork.
The cost of reactive monitoring
When teams lack baselines, they either ignore minor deviations or overreact to normal variance. Both outcomes create instability. Over-alerting leads to alert fatigue. Under-alerting leads to delayed detection.
Web scraping observability depends on context. Scraping performance metrics only become meaningful when compared against expected historical behavior.
What mature baseline design looks like
Effective baseline systems include:
- Rolling 7-day and 30-day performance bands
- Segmented baselines per source, not global averages
- Seasonality-aware thresholds
- SLA tracking aligned to dataset criticality
- Versioned baselines after major site redesigns
Challenge 7: Weak Schema Drift Detection Across Pipelines
Schema drift rarely looks dramatic
When websites change structure, they rarely remove everything at once. More often, they rename classes, wrap elements in additional containers, convert numeric fields into formatted strings, or introduce optional variants. The scraper still runs. Rows are still produced. Nothing crashes.
But the schema has shifted.
If web scraping monitoring does not include schema drift detection, these structural changes move quietly into downstream systems. Type mismatches get coerced. New fields are ignored. Old fields become sparsely populated. The pipeline continues to function while data meaning degrades.
Where schema drift hides
Schema drift affects multiple layers:
- Field additions that are never captured
- Field removals that convert required columns into null-heavy ones
- Type changes such as integers becoming strings with currency symbols
- Nested structure changes that flatten incorrectly
- Ordering changes that break brittle parsing logic
Traditional error logging does not catch these because the process itself succeeds.
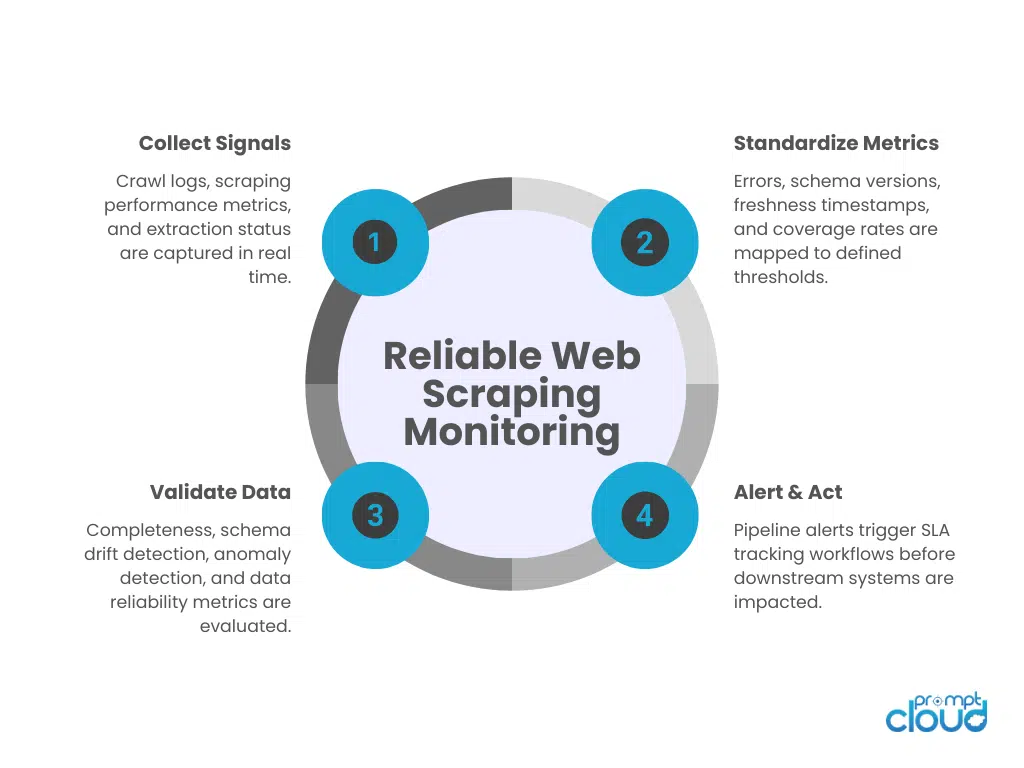
Figure 2: End-to-end flow of a structured web scraping monitoring system from signal capture to SLA-aligned alerting.
Why this becomes a reliability issue
Downstream consumers rely on structural consistency. Analytics queries expect stable columns. ML pipelines assume predictable types. When schema drift goes undetected, it introduces subtle instability. Queries fail intermittently. Feature engineering logic breaks. Data reliability metrics decline.
And because the change was structural rather than catastrophic, root cause analysis becomes slow.
What strong schema observability requires
Web scraping observability should include automated schema comparisons:
- Snapshotting column structure per run
- Comparing field presence and types against expected definitions
- Flagging new, removed, or type-shifted fields
- Alerting only when drift impacts required fields or SLAs
Schema drift detection is not optional in production systems. Without it, web scraping monitoring protects execution, but not structure.
Challenge 8: Data Freshness Monitoring Without SLA Context
Freshness measured without purpose
Many teams track timestamps but do not define what “fresh” actually means. A dataset may show a recent crawl time, but that does not guarantee that the content changed or that it reflects the current state of the source.
Web scraping monitoring often logs last-run time, not last-meaningful-update time.
If your freshness metric only answers when the job is executed, you are measuring scheduler health, not data relevance.
Why freshness becomes misleading
Freshness problems typically surface in subtle ways:
- The site updates every 2 hours, but your scrape runs daily
- The crawl runs on schedule, but the site serves cached content
- Incremental logic skips pages where timestamps appear unchanged
- Dynamic sections load updates after initial HTML extraction
Without proper data freshness monitoring, the pipeline can appear compliant while lagging behind real-world changes.
SLA tracking is the missing layer
Freshness must be tied to explicit SLAs. Not all datasets require the same update frequency. Competitive pricing data might demand hourly refresh. Long-form content archives may tolerate weekly updates.
When SLA tracking is absent, teams cannot distinguish between acceptable delay and critical breach. Alerts either never trigger or trigger constantly.
What effective freshness observability looks like
Strong web scraping observability includes:
- Source-specific freshness SLAs
- Tracking of last-seen change, not just last crawl
- Change-rate metrics per key field
- Alerts tied to SLA breach severity, not arbitrary time windows
- Freshness views embedded into the crawl health dashboard
Challenge 9: Anomaly Detection That Lacks Business Context
Statistical anomalies are not always business problems
Many teams add anomaly detection to improve web scraping monitoring. They track deviations in record counts, null rates, response times, and distribution shifts. On paper, this strengthens web scraping observability.
But anomaly detection without business context generates misleading signals.
A 15 percent drop in listings might be expected during seasonal slowdowns. A spike in price variance may reflect a real promotion event. A sudden surge in new SKUs might be a catalog expansion, not a parsing issue.
Purely statistical anomaly detection treats every deviation as suspicious.
Where context gaps create confusion
Anomaly detection becomes noisy or useless when it ignores:
- Known seasonal patterns
- Campaign periods or promotions
- Geo-specific fluctuations
- Inventory resets
- Regulatory or platform-level changes
Without contextual layering, alerts require manual interpretation every time. That slows failure detection instead of accelerating it.
Why this undermines trust
If analysts constantly review anomalies that turn out to be legitimate business changes, they begin to distrust alerts. That distrust spreads. When a real failure occurs, it risks being dismissed as “just another anomaly.”
Observability without context becomes performative rather than protective.
What context-aware monitoring requires
Mature web scraping monitoring connects technical metrics to business expectations:
- Seasonality-aware baselines
- Known-event calendars integrated into alert logic
- Segmented anomaly thresholds per category or geo
- Business-impact tagging for alerts
- SLA tracking aligned to revenue or decision-critical datasets
Challenge 10: No Unified Crawl Health Dashboard Across the Stack
Fragmented visibility creates blind spots
In many organizations, web scraping monitoring is scattered across tools. Infrastructure metrics live in one dashboard. Error logging sits in another. Data validation checks are buried in data warehouse queries. SLA tracking might exist in a spreadsheet owned by someone in analytics.
Each system shows part of the story. None show the whole pipeline.
This fragmentation makes root cause analysis slow. When scraping performance metrics dip, engineers have to correlate logs, validation reports, and freshness views manually. During incidents, time is lost just figuring out where to look.
Why fragmentation persists
Scraping systems evolve incrementally. Teams add failure detection, then schema drift detection, then anomaly detection. Each layer is bolted onto an existing stack. Rarely is observability designed end-to-end from the beginning.
The result is tooling sprawl without cohesive design.
The operational consequences
Without a unified crawl health dashboard, you face:
- Delayed detection because signals are siloed
- Repeated investigation across teams
- Inconsistent SLA tracking
- Missed correlations between infrastructure errors and data anomalies
- Reduced accountability because no single source of truth exists
Fragmentation amplifies every other monitoring weakness discussed earlier.
What unified observability actually means
A mature web scraping observability layer consolidates:
- Infrastructure health
- Scraping performance metrics
- Data reliability metrics
- Schema drift detection
- Freshness SLAs
- Pipeline alerts with severity mapping
Summary: Monitoring vs Observability Failure Points
| Challenge | What It Looks Like | What to Monitor Instead |
| Job-Level Monitoring | Crawl runs successfully | Field completeness + volume baselines |
| Infrastructure-Only Metrics | Green dashboard, bad data | Validation pass rates + uniqueness |
| Alert Fatigue | Dozens of minor alerts daily | Severity-tiered SLA-based alerts |
| Silent Degradation | Gradual record decay | Time-series drift detection |
| Ownership Gaps | No one owns data SLAs | Named accountability per metric |
| No Baselines | Deviations unclear | Rolling segmented baselines |
| Weak Schema Detection | Structural shifts unnoticed | Automated schema comparison |
| Freshness Without SLA | Job ran, data stale | Last-meaningful-update tracking |
| Context-Free Anomalies | Alerts during seasonality | Business-aware thresholds |
| Fragmented Dashboards | Signals scattered | Unified crawl health dashboard |
What separates reliable scraping systems from fragile ones
Most scraping failures are not technical accidents. They are visibility failures.
Teams assume that because the crawler runs, the data is intact. They rely on infrastructure monitoring and treat data validation as an afterthought. Over time, this creates silent gaps. Small selector issues turn into partial datasets. Schema drift slips into pipelines. Freshness lags behind reality. Alerts either scream too often or not at all.
The difference between fragile and reliable systems is not more code. It is disciplined web scraping monitoring combined with structured web scraping observability.
Reliable teams define baselines before they define alerts. They treat schema as a contract, not a suggestion. They measure completeness, freshness, and distribution, not just job success. They track data reliability metrics longitudinally, not just per run. And most importantly, they assign ownership.
If you are building AI-ready pipelines, this becomes even more critical. Structured observability is what allows systems like the architectures discussed in modern AI data pipeline design to operate without constant human babysitting. It is also why teams preparing for large-scale AI workloads must think beyond crawling scripts and toward AI-ready web data infrastructure.
When data feeds pricing models, market intelligence, compliance systems, or large language models, monitoring cannot stop at execution. It has to answer whether the data still reflects the real world.
Web scraping monitoring is not about avoiding crashes. It is about protecting decision integrity. And decision integrity depends on visibility.
What separates successful teams is operational discipline. They monitor data integrity, not just crawler uptime. This is why News Data Feeds requires structured freshness tracking, drift detection, and SLA-backed delivery. Organizations reaching this realization often evaluate managed, reliability-first data feed solutions.
If you want to go deeper
- Guide to extracting Airbnb data for travel intelligence teams
- AI-ready web data infrastructure in 2025
- What makes web data AI-ready
- AI data pipeline architecture for production systems
The Google Site Reliability Engineering handbook outlines how monitoring should be tied to service-level objectives rather than raw system metrics. The principle applies directly to scraping systems: measure what affects users, not just infrastructure.
PromptCloud’s observability layer monitors field-level completeness, schema integrity, and freshness SLAs across enterprise pipelines processing millions of records daily.
“Before observability, we discovered data issues through customers. Now we discover them through metrics.”
Director of Data Engineering
Global Marketplace
FAQs
1. What is the difference between web scraping monitoring and web scraping observability?
Web scraping monitoring typically tracks whether jobs run successfully and whether infrastructure is stable. Web scraping observability goes deeper by measuring completeness, freshness, schema stability, and data reliability metrics to ensure the dataset remains trustworthy.
2. Why does web scraping monitoring fail to detect silent data issues?
Most systems rely on job-level success indicators. If the script does not crash, it is marked as successful. Without field-level validation, schema drift detection, and anomaly detection tied to baselines, silent degradation goes unnoticed.
3. How can teams reduce alert fatigue in scraping pipelines?
Alert fatigue decreases when alerts are severity-tiered, baseline-aware, and tied to business impact. Grouping related failures and mapping alerts to actionable remediation paths prevents teams from ignoring important signals.
4. What role does schema drift detection play in observability?
Schema drift detection ensures that structural changes in source websites do not silently alter data types, remove required fields, or introduce new unmapped fields. Without it, downstream analytics and AI systems become unstable.
5. How should freshness be monitored in web scraping systems?
Data freshness monitoring should be aligned with defined SLAs per dataset. Instead of tracking only last-run time, teams should track last-meaningful-update time and flag breaches based on business-critical thresholds.