Brand affinity in a highly competitive, commoditized B2C environment, BRAND is the only moat a company can rely on for sustainable margins and profitability. It’s easier said than done, but what makes a brand is an interesting question to ponder. All consumer-facing businesses strive to register a certain kind of reputation through their products with various tools available at their disposal whether it is designed, messaging, positioning etc. Albeit, very few managed to achieve the esteemed status where the customer is willing to pay extra bucks for the brand, they want themselves to be associated with.
BRAND IS NOT WHAT YOU SAY IT IS, IT’S WHAT THEY SAY IT IS – Marty Neumeier
The above quote by Marty Neumeier, who authored many books on branding, sums up as “a thinking gap that exists between brands and customers”. Though there are tools like perceptual maps that many market researchers and businesses use, to depict brand affinity, on how the consumer perceives and feels about a brand. It is fair to say that it’s still a mirage that ‘you’, as a company, think it exists, but can never be so sure.
Post pandemic effect on B2C retail companies
The pandemic showed the importance for a consumer-facing business to be present in multiple retail channels, including offline and online platforms for delivering an omnichannel experience to all its customers. The traditional offline retail-focused brands were hit badly, whereas many digital-first that focussed on online channels have grown multifold during the same time period. It’s two sides of the coin, but the delta is too big to ignore. This accelerated trend in eCommerce adoption and forced offline retail B2C companies to give equal importance to their online presence.
Importance of consumer reviews and ratings
Unlike offline retail, there is an abundance of data on brand products available across multiple eCommerce channels, which can be streamlined through various data crawling techniques, depending on the use-case a brand is seeking answers for. Brand affinity marketing helps to answer questions like, If a company would like to comprehend how the customers are perceiving my brand, how can one go about it? What are the metrics they can rely on?
The obvious answer for this would be customer reviews and ratings. A brand’s perception can be measured by accumulating the customer reviews and ratings for all the products a brand is offering, across multiple categories. You’ll see inferences related to the most loved products to low selling one’s. These products drive a brand’s narrative depending on the percentage of products consumers love or hate, can a brand story be explained?
Interpreting a Brand’s Story
A brand is majorly depicted by the company story, the narrative is driven by the products they are offering and how the customers are perceiving those products. Some products could be Hero SKUs, underperforming SKUs, or Emerging SKUs and then there are the others who could be – Duds!
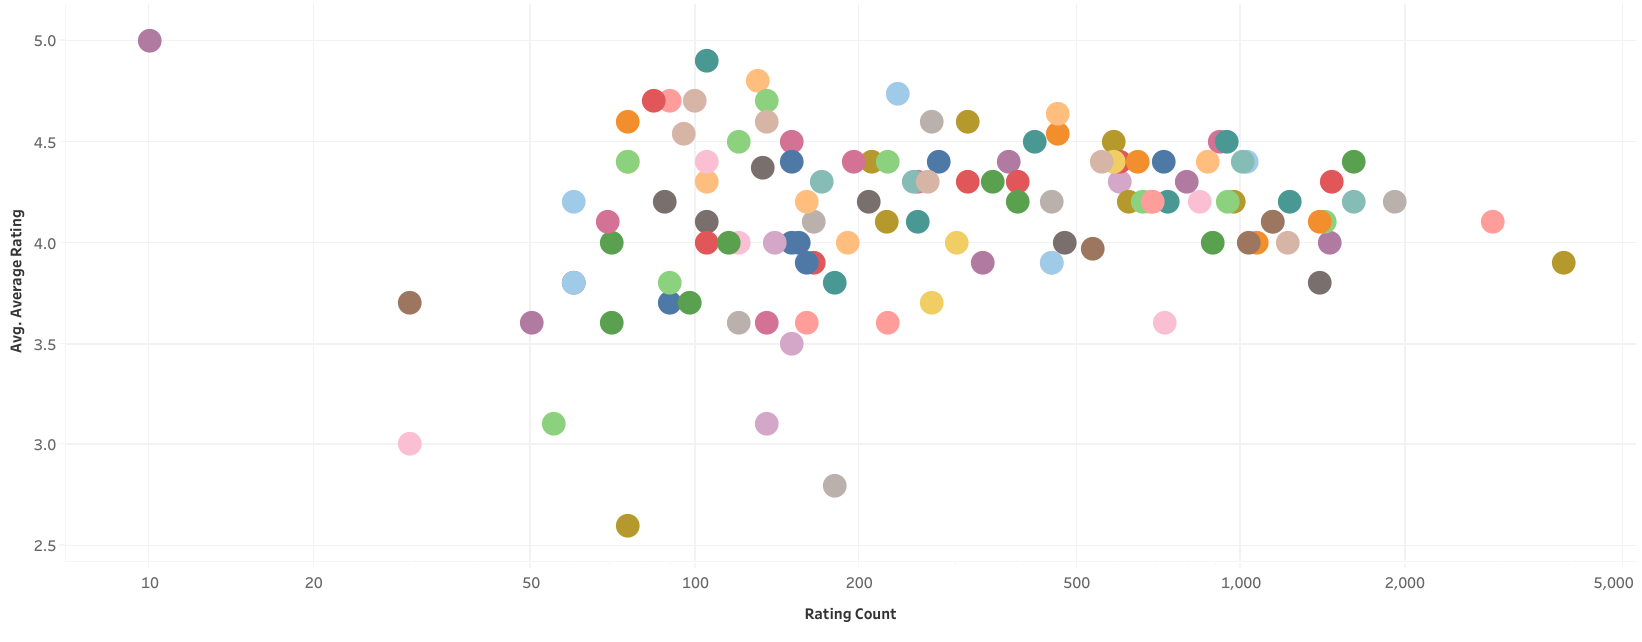
Consider the following ratings and reviews landscape of an apparel brand in Myntra. Each dot represents a product that falls at a particular place in the landscape depending on the number of customers rated the product and the accumulated avg.rating for a particular product.
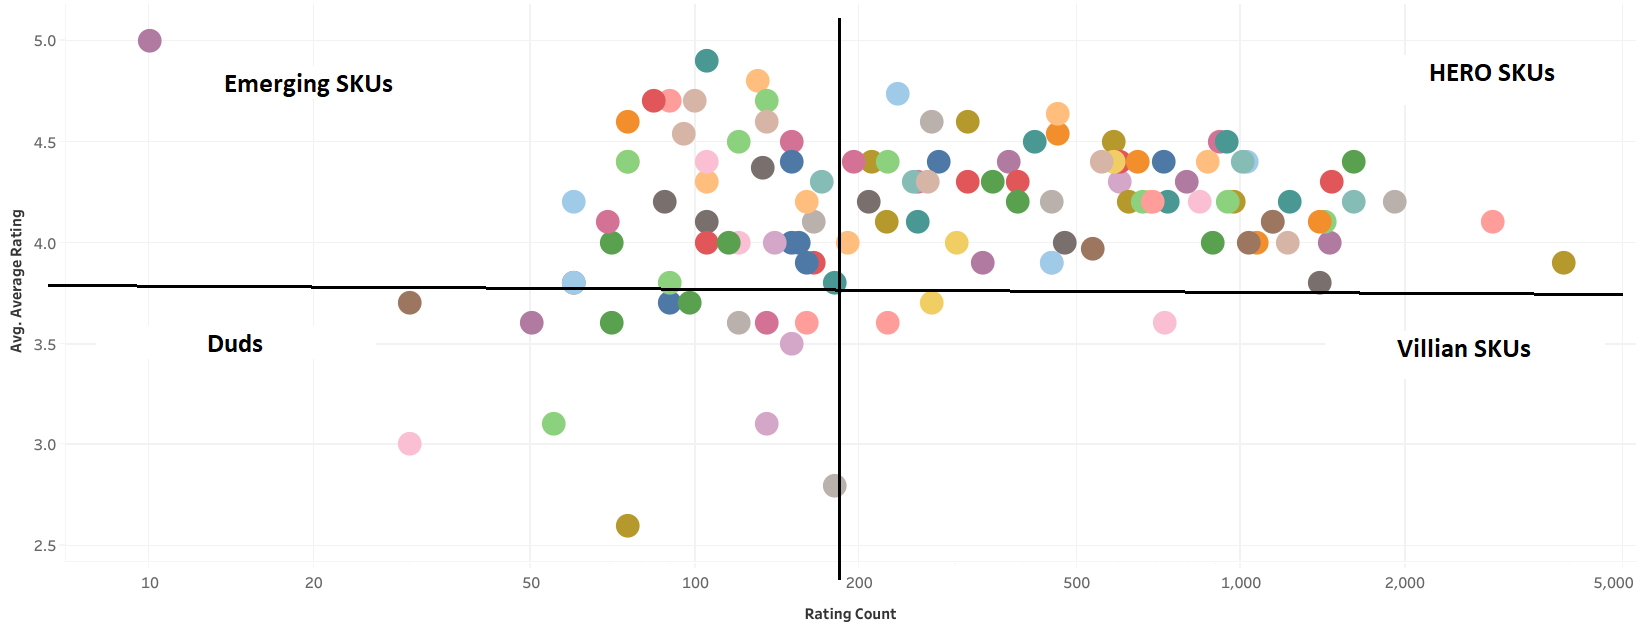
Framework to visialize Brand Affinity
If the landscape is divided into four equal quadrants as given below, then we have products that have the maximum number of ratings and reviews on the top right quadrant called, Hero SKUs. Products that fall under the top left quadrant are the ones which are rated high, but the number of customers rating these products are relatively low (emerging SKUs). Similarly, the products lying bottom side of quadrant that are generally rated badly by the customers impacting the brand reputation and these are the Duds or the Villian SKUs.
As time goes by, a product ages and tends to move from one quadrant to another, the emerging SKUs could become Hero SKUs or the Duds can become Villains or for brand’s hope sake, the villains can become Heros. The recurring data extraction for a specific brand can help them to visualize the change in the narrative, comprehend the percentage of products falling in which quadrant and hence, enable them to take proactive measures accordingly.
Final thoughts
Doing this comparison over time helps a brand to track their product’s progress, for example, are the Hero products increased when compared to last quarter? Percentage of Villain/Duds products present now in comparison to last quarter?
The framework presented here is one part of the puzzle for a brand to understand the consumer’s mind and the products they love/hate. There are other methods one can consider like the extraction of reviews text and performing sentiment analysis on top of it to comprehend the specific aspects the consumers like or dislike about the product or brand.