Hotel reviews are gold mine of customer insights for any hotel business. Also, its importance increases by many folds since majority of the future customers rely on the peer reviews while finalizing their stay. In this study, we will analyse the reviews for the top 10 most expensive and least expensive hotels based out of London to compare various aspects of the rating and review text.
The data set
The review data was extracted from a leading travel site via PromptCloud’s in-house custom crawling solution. Back in September, we selected a particular date of this month for stay in London-based hotels (hostels were excluded) and sorted them with respect to price to select the hotels. The final number of reviews that we extracted is more than 27,000 with the following data fields:
- Property name
- Rating
- Review title
- Review text
- Location of reviewer
- Date of review
You can download this for free by signing up for DataStock – one of our solutions to download pre-crawled web data sets instantly.
Goals
Here is what we’ll find out from this research for both of the hotel categories:
- Comparison of overall rating
- Comparison of the review count
- Time series analysis of review count
- Comparison of review length
- Analysis of frequently used words
- Trending words present in review text
- Sentiment analysis to find out positive and negative words
- Sentiment analysis for overall scores for polarity and emotions
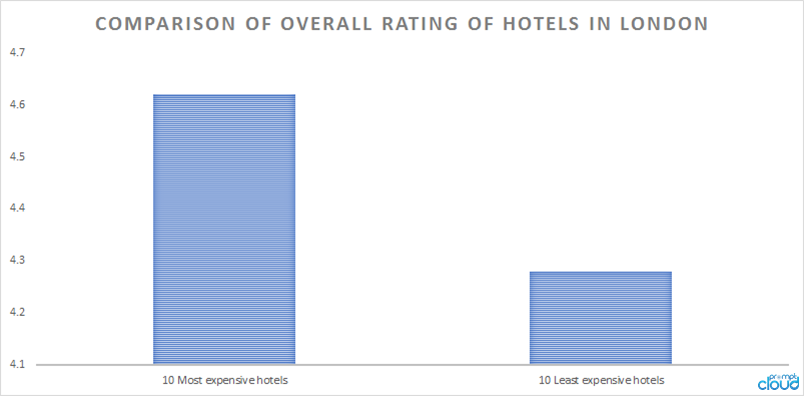
Comparison of overall ratings
The chart shows that the most expensive hotels have average rating of 4.62, which is negligibly higher than the rating of least expensive ones (4.28). The important factor is that the two types of hotels at both ends of spectrum, have received overall ratings of more than 4.
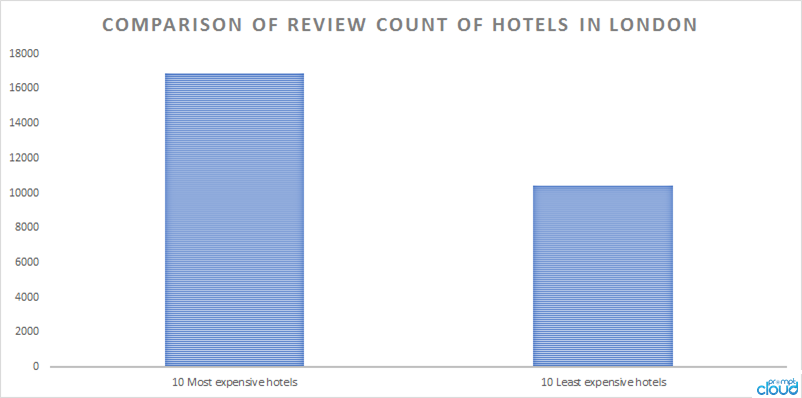
Comparison of the review count
This shows that the most expensive segment has received more number of reviews than the least expensive segment. In the next chart we will look at the number of reviews over the years to find out the trend in review count.
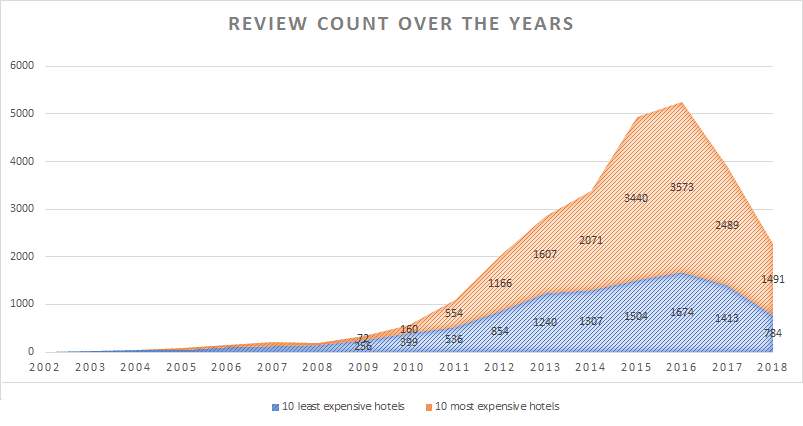
Number of reviews over the years
This particular analysis shows that the number of reviews for the least expensive segment was higher than expensive ones from year 2002 to 2010 (except 2005). However, since 2011 the review counts have reversed. The beginning of reversal can be attributed to the renovation of Corinthia Hotel in 2011 which started receiving reviews from 2011 and The Savoy’s review (count increased significantly from 2011).
 Comparison of review length
Let’s now find out the average review length (excluding whitespace) of the two types of hotels to see which one receives lengthier reviews.
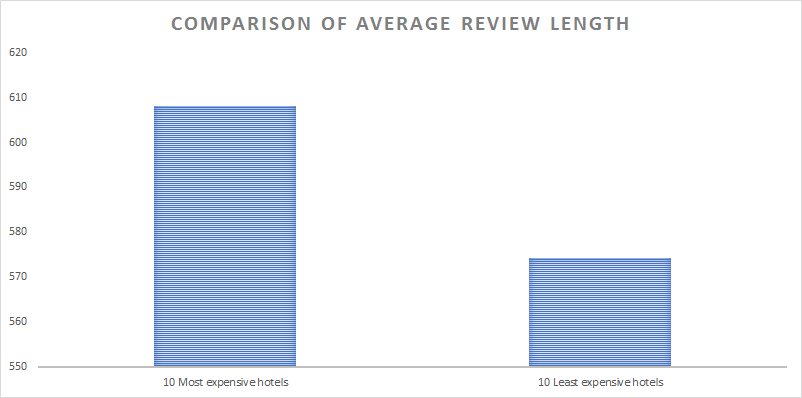
This chart shows that expensive hotels receive lengthier reviews (608 vs. 574).
Frequently used words in reviews
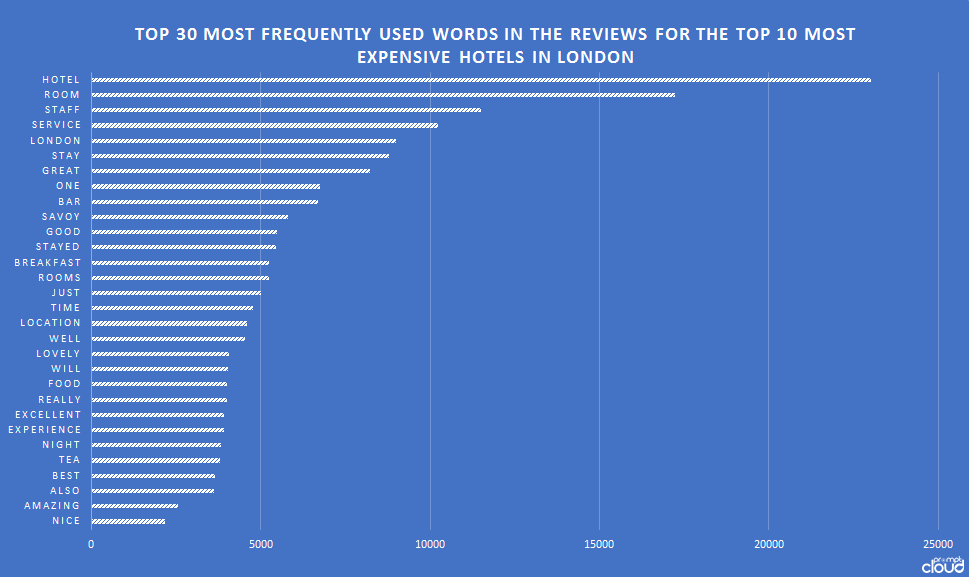
The charts given below will show us the top 30 most frequently used words in the reviews.
In case of expensive hotels, following words are prevalent: ‘staff’, ‘service’,’stay’,’bar’, ‘breakfast’, ‘rooms’ and ‘location’. In terms of hotels, The Savoy is the only hotel which has emerged in the frequent words used for reviews.
Let’s find out how the reviews differ for the least expensive ones.
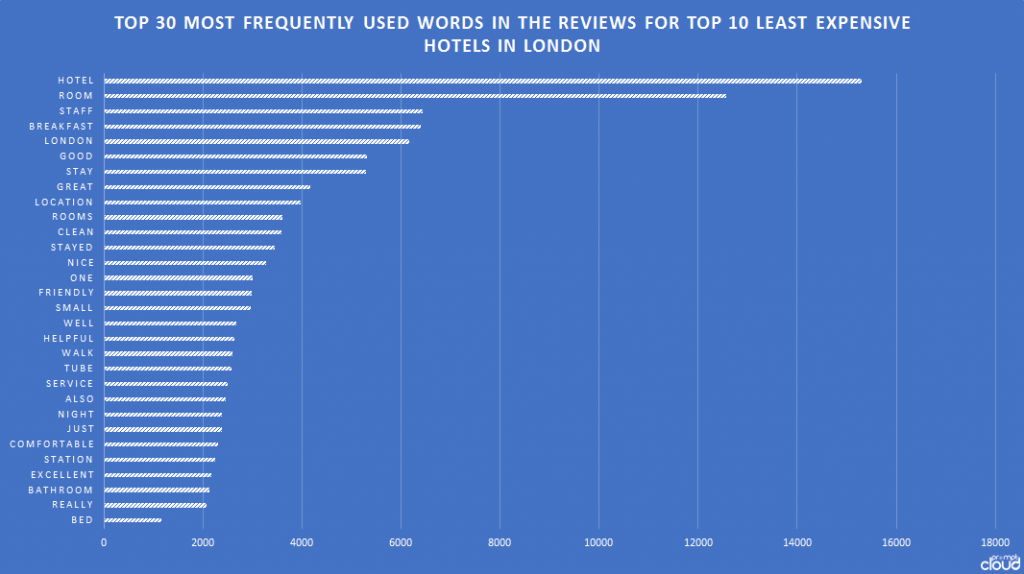
We see that in both of the cases, staffs are major factor. The other most frequent words are ‘breakfast’, ‘stay’, ‘location’, ‘rooms’, ‘clean’, ‘small’, ‘station’, ‘bathroom’ and ‘bed’. It is interesting to see that ‘breakfast’ has higher count here in comparison to the reviews for expensive hotels.
Trending words present in review text
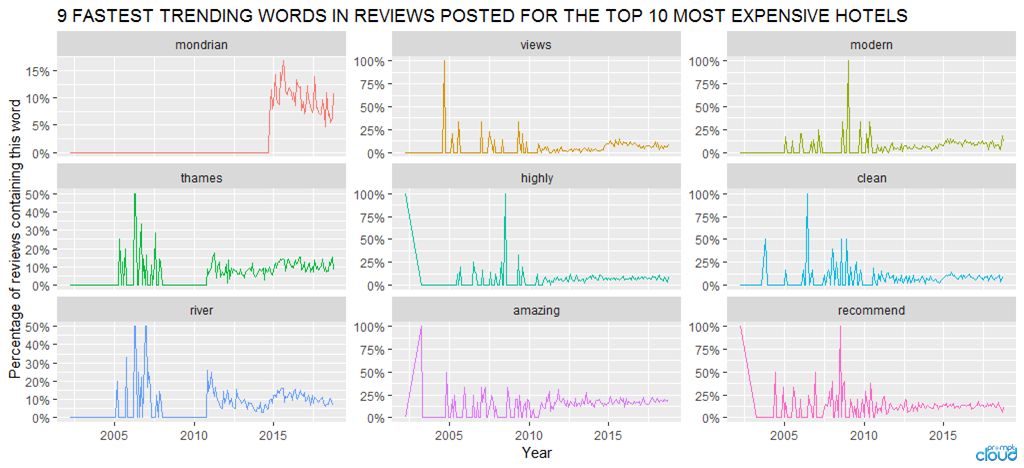
Let’s find out the words that have become more frequent (or trending) over the years. This can help uncover the underlying themes in the reviews whose importance is growing.
The following chart shows that discussions around ‘views’ and ‘thames’ picked up around 2005, while ‘clean’ and ‘modern’ spiked in between 2005 and 2010. The word ‘river’ has also registered significant interest after 2005 and 2010. Also, we see that Mondrian London started trending since its inception in 2014.
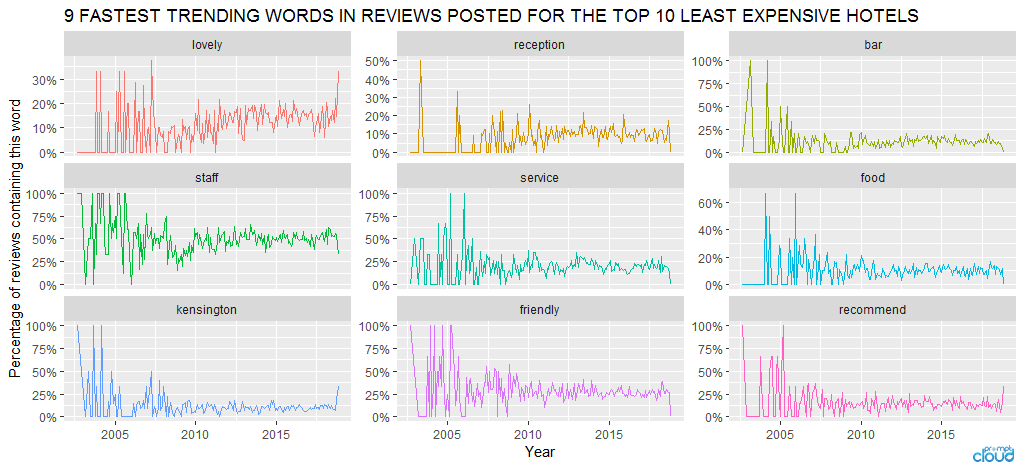
The following charts show that in case of least expensive hotels, discussions around ‘reception’, ‘bar’, ‘staff’, ‘service’ and ‘food’ have been trending. We also see that the location Kensington has captured significant conversation which is an upscale location with regal charm and quite near to London’s important attractions.
 Sentiment analysis
Now, we’ll compare the overall scores for various emotions and polarity (positive/negative) via sentiment analysis.
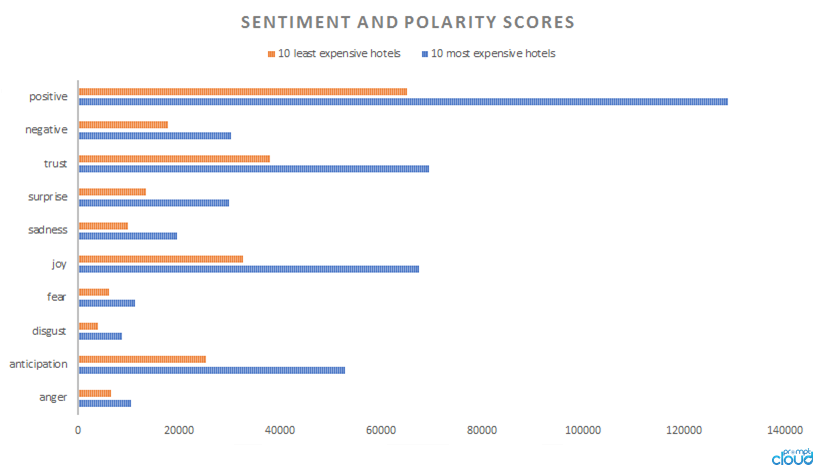
There is not much difference if we look at the common pattern for the scores. Overall, they are largely positive for both of the hotel types. In case of emotions, ‘trust’, ‘joy’, and ‘anticipation’ are the prevalent ones.
Positive and negative words
What are the frequently used positive and negative words present in the hotel reviews? Let’s start in the most expensive segment.
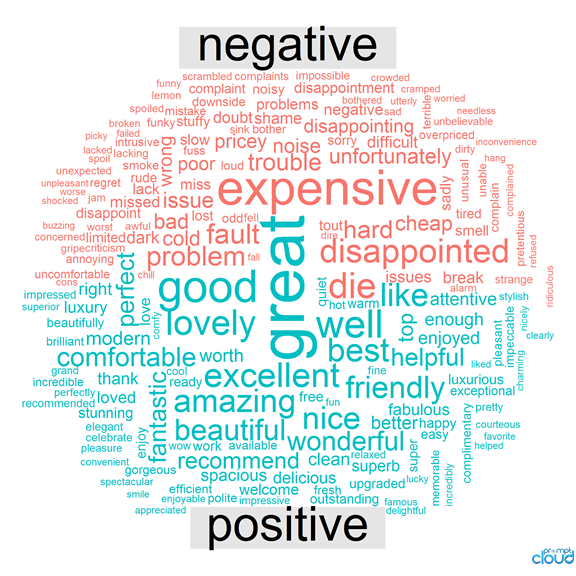
The irony is that in the negative words for this category of hotels, we see ‘expensive’ as the most frequent word. In the positive words, we see ‘friendly’, ‘comfortable’, ‘attentive’ as some of the important terms. How does this change for the least expensive category?
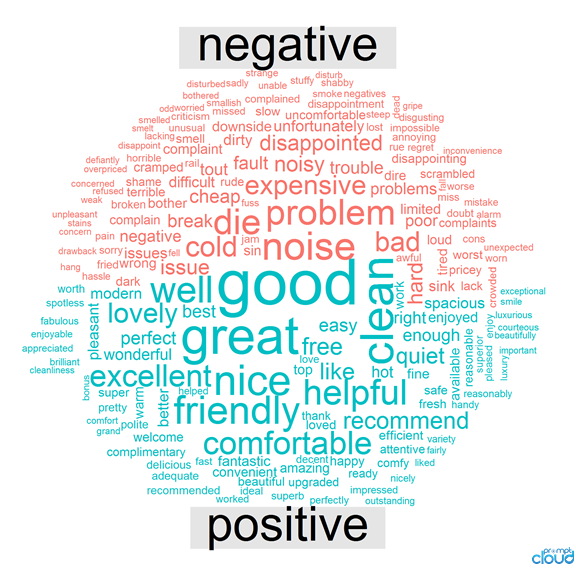
While ‘expensiveness’, ‘die’ (both are common with the two categories) and ‘noise’ have emerged as the most frequent terms in the negative words, in case of positive terms, ‘clean’, ‘friendly’, ‘helpful’ and ‘comfortable’ are the most notable ones.
Over to you
This sums our elemental study of the reviews. Now it’s time for you to download the data set and analyze. To start off, create network graph of bigrams, perform topic modelling techniques, find out the terms associated in positive/negative words and compare the importance of various factors (e.g., location vs. service) considered during decision making process.