Web data to insights only works when the pipeline is disciplined
Collecting web data is relatively straightforward. Extracting fields from a site, storing them, and running queries can be done quickly with modern tooling.
The difficulty begins after extraction. Raw scraped output is not decision-grade web data. It is unstructured, inconsistent, and often incomplete. Fields vary across sources. Units differ. Categories are ambiguous. Entities are duplicated. Values are noisy.
Organizations often assume that once structured data extraction is complete, insight generation will follow naturally. It does not. Turning web data to insights requires systematic data normalization, enrichment, validation, transformation pipelines, and analytics readiness checks. Without those layers, dashboards display numbers, but those numbers do not support reliable decisions.
The gap between collected data and decision-grade web data is operational, not conceptual.
This article breaks down the ten structural challenges that prevent organizations from converting web data into reliable, business-ready insights.
Raw web data is not decision-grade web data. Between extraction and reliable insight sit ten structural layers: normalization, entity resolution, enrichment, validation, transformation discipline, monitoring, historical continuity, and governance. When any layer is weak, dashboards display numbers — but decisions degrade. These challenges are amplified when the input is volatile web-scraped data rather than clean internal databases.
Get structured Booking.com review datasets to track sentiment, identify service gaps, and benchmark competitors.
In production web data pipelines we support, teams that implement continuous validation and quality monitoring detect insight-breaking issues an average of 2–4 days earlier than teams relying on ad hoc review inside BI tools.
Challenge 1: Raw Extraction Is Not Analytics-Ready
Why structured data extraction is only the starting point
Most teams equate structured data extraction with usable data. If the scraper returns clearly labeled fields in JSON or CSV format, the job feels complete.
In reality, structured does not mean standardized. Different sources represent similar attributes differently. One site stores prices with currency symbols. Another splits price and discount. A third includes tax in the final value. Dates follow inconsistent formats. Categories use different naming conventions.
Turning web data to insights fails at this first layer when extracted fields are treated as analysis-ready without normalization.
What breaks without normalization
Without systematic data normalization, you encounter:
- Inconsistent units across datasets
- Misaligned categorical labels
- Mixed date and time formats
- Duplicate entity identifiers
- Conflicting naming standards
When these inconsistencies reach BI integration or reporting layers, insight generation becomes unreliable.
Decision-grade web data requires consistent semantics across all sources.
Why normalization must precede analysis
Data normalization is not cosmetic cleanup. It is structural alignment.
Before any data transformation pipelines are built for reporting, the raw output must be mapped into a unified schema. Categories must be standardized. Numeric fields must be harmonized. Time formats must be aligned. Without this discipline, web data to insights becomes a process of correcting inconsistencies manually inside dashboards, which introduces human error and inconsistent interpretation.
Normalization is the first barrier between collected data and decision-grade web data.
Challenge 2: Entity Resolution Becomes a Hidden Bottleneck
Why duplicate entities distort insights
When turning web data to insights, one of the most underestimated problems is entity resolution.
Different sources describe the same product, company, job role, or location in slightly different ways. Names vary. Identifiers are inconsistent. Abbreviations differ. Attributes may overlap partially. If those variations are not reconciled, the system treats one real-world entity as multiple separate records.
This distorts insight generation.
What poor entity resolution causes
Without structured entity resolution, you see:
- Inflated counts of products or listings
- Fragmented performance metrics across duplicates
- Misleading market share calculations
- Incorrect trend analysis
- Conflicting BI integration outputs
Decision-grade web data requires a clean, unified representation of entities across sources. When entity resolution is weak, the insights may look precise but are structurally flawed.
Why entity resolution requires deliberate design
Entity resolution is not a simple deduplication task. It requires:
- Matching logic based on multiple attributes
- Similarity thresholds tuned to domain context
- Normalized identifiers across datasets
- Data enrichment layers to strengthen matching
- Continuous data quality monitoring to detect merge errors
Challenge 3: Data Enrichment Is Treated as Optional
Why raw attributes rarely answer business questions
Raw web data often captures surface-level attributes. Titles, prices, descriptions, categories, timestamps.
Those fields are necessary, but they are not always sufficient for insight generation. Decision-grade web data requires context. Without enrichment, datasets remain descriptive rather than analytical.
For example, scraped product listings may include brand names and descriptions, but not standardized brand hierarchies. Job listings may include titles, but not normalized skill taxonomies. Reviews may include text, but not sentiment scores.
Turning web data to insights requires additional structure beyond extraction.
What happens when enrichment is skipped
Without data enrichment, organizations face:
- Overly manual BI integration workflows
- Analysts building one-off transformation logic in dashboards
- Inconsistent categorizations across reports
- Limited ability to segment or benchmark
- Slower analytics readiness cycles
The burden shifts downstream. Instead of centralized data transformation pipelines, insight preparation happens inside reporting tools, which creates fragmentation and inconsistency.
Concrete Example: Why Enrichment Changes Insight Quality
Consider ecommerce review data. Raw extraction captures review text and rating. Without enrichment:
- Sentiment is inferred manually
- Themes are not categorized
- Brand hierarchy is not normalized
After enrichment:
- Review text is sentiment-scored consistently
- Topics are classified into standardized issue categories
- Brand relationships are mapped into parent-child structures
The same raw dataset produces dramatically different insights depending on whether enrichment is embedded in the pipeline or improvised in BI tools.
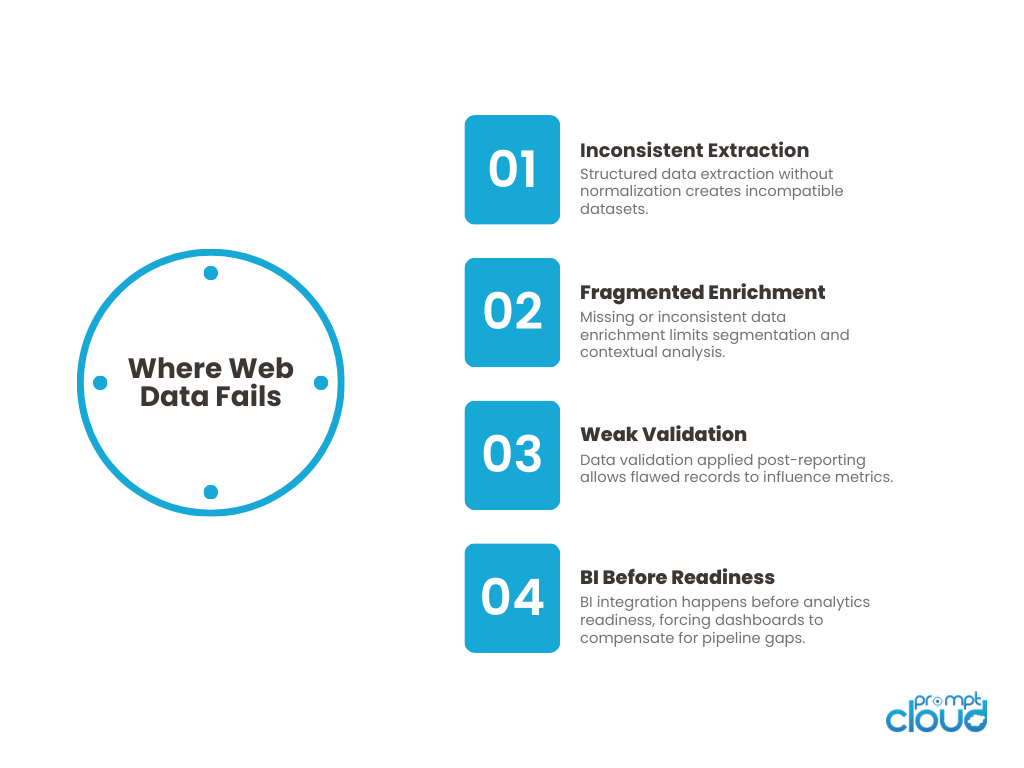
Figure 1: Common structural breakdowns that prevent organizations from turning web data to insights effectively.
Why enrichment must be systematic
Data enrichment should be part of the core pipeline, not an afterthought.
Effective enrichment includes:
- Standardized taxonomies applied during ingestion
- Derived metrics calculated consistently
- Entity tagging for segmentation
- Structured classification of text fields
- Alignment with analytics-ready schemas
Challenge 4: Data Validation Is Implemented Too Late
Why teams validate after reporting breaks
In many organizations, data validation is reactive. It begins after a dashboard shows anomalies, a report looks incorrect, or stakeholders question numbers. At that point, validation becomes incident response. Turning web data to insights requires validation before analytics layers consume the dataset. If data validation is delayed, corrupted records propagate into BI integration tools and downstream systems.
DIY checks inside spreadsheets are not sufficient for decision-grade web data.
What weak validation allows
Without structured data validation, teams encounter:
- Out-of-range values that distort aggregates
- Null-heavy fields skewing trend analysis
- Mixed data types breaking calculations
- Partial batch failures treated as complete datasets
- Silent schema shifts affecting reports
These issues undermine analytics readiness. Once flawed data is embedded into insight generation workflows, rollback becomes complex.
Why validation must be built into the pipeline
Effective data validation includes:
- Field-level rule enforcement
- Range and format checks
- Mandatory attribute verification
- Schema stability monitoring
- Automated data quality monitoring dashboards
Challenge 5: Data Transformation Pipelines Become Overcomplicated
Why transformations grow beyond control
Once extraction, normalization, entity resolution, and enrichment layers are added, data transformation pipelines start to expand. Each new business request adds logic. A new KPI requires a derived field. A new dashboard requires a calculated metric. A new segment requires additional joins. Turning web data to insights becomes difficult when transformation logic is layered incrementally without architectural discipline.
Over time, pipelines become dense, brittle, and hard to modify.
What pipeline complexity causes
When data transformation pipelines are not structured carefully, teams face:
- Cascading failures when upstream fields change
- Long rebuild times for historical datasets
- Conflicting metric definitions across departments
- Hardcoded business logic embedded deep in queries
- Increasing difficulty onboarding new analysts
Analytics readiness suffers because transformation pipelines stop being transparent. Instead of enabling insight generation, they become a maintenance challenge of their own.
Why transformation discipline matters
Decision-grade web data requires transformation layers that are:
- Modular rather than monolithic
- Version-controlled
- Documented with clear metric definitions
- Separated from raw ingestion layers
- Designed for backward compatibility
Managing pipeline complexity is the structural problem. Challenge 9 shows what happens when that complexity is not versioned across time.
Experiencing These Challenges?
Get structured Booking.com review datasets to track sentiment, identify service gaps, and benchmark competitors.
Analytics teams across retail, recruitment, and financial intelligence use PromptCloud’s structured pipelines to power forecasting, benchmarking, and pricing decisions.
“Before formalizing normalization and validation, we spent more time reconciling dashboards than acting on insights. Once the pipeline discipline improved, reporting stabilized.”
Head of Analytics
Global Retail Platform
Challenge 6: Data Quality Monitoring Is Not Continuous
Why one-time cleanup does not guarantee reliability
Many teams invest heavily in initial cleanup. They normalize fields, resolve entities, enrich attributes, and validate the first few batches carefully.
Then monitoring slows down. Turning web data to insights requires continuous data quality monitoring, not periodic audits. Website changes, upstream shifts, and internal pipeline updates introduce new inconsistencies over time. If monitoring is not persistent, data quality slowly degrades.
What weak monitoring looks like
Without ongoing data quality monitoring, organizations experience:
- Gradual drift in category distributions
- Increasing null rates in non-mandatory fields
- Subtle shifts in derived metrics
- Declining freshness across certain sources
- Inconsistent entity matching over time
These changes rarely trigger alarms unless monitoring thresholds are defined clearly. Decision-grade web data depends on sustained reliability, not one-time alignment.
Why monitoring must be tied to insight usage
Effective monitoring aligns with how insights are consumed. If a pricing dashboard depends on hourly freshness, freshness must be tracked continuously. If recruitment analytics depends on accurate role normalization, entity resolution must be monitored consistently.
Web data to insights becomes durable when:
- Data quality monitoring dashboards are automated
- Validation metrics are tracked longitudinally
- Anomalies trigger investigation workflows
- Data transformation pipelines expose quality metrics
- BI integration layers reflect quality flags transparently
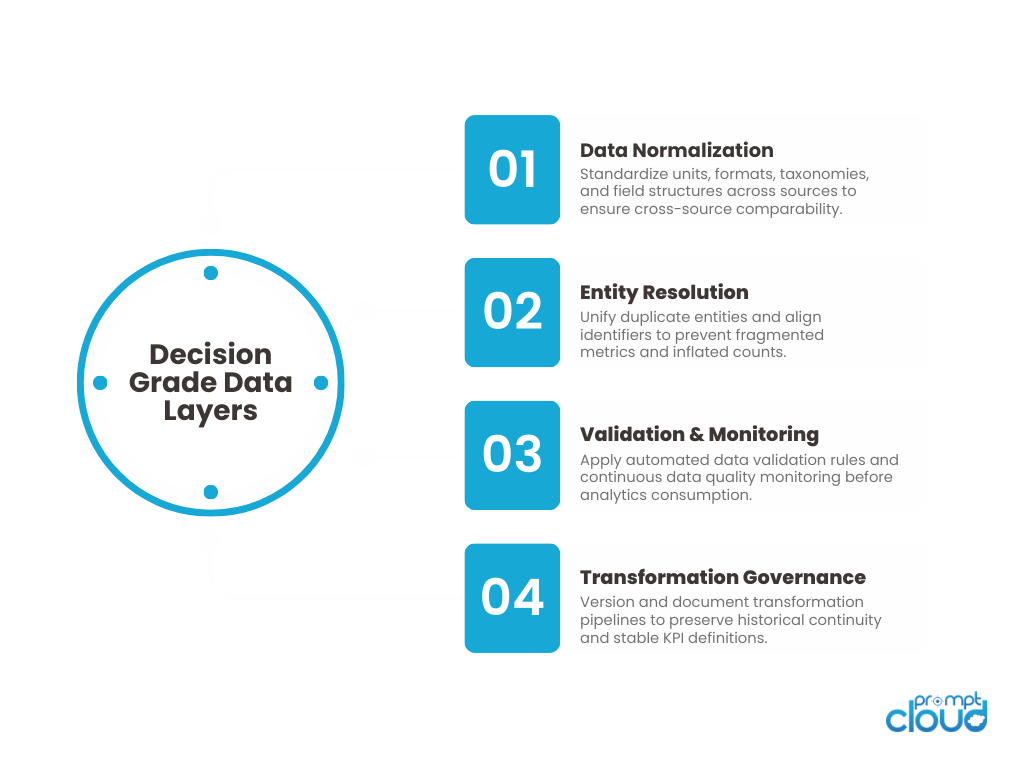
Figure 2: Core architectural layers required to convert web data to insights and achieve decision-grade web data reliability.
Challenge 7: BI Integration Happens Before Analytics Readiness
Why dashboards expose pipeline weaknesses
Teams often rush to connect scraped datasets directly to BI tools. The goal is speed. Stakeholders want dashboards quickly. Analysts want visibility. The problem is that BI integration does not create analytics readiness. It only visualizes what exists.
If normalization, entity resolution, enrichment, and validation are incomplete, dashboards amplify structural weaknesses. Turning web data to insights fails when reporting precedes readiness.
What premature BI integration causes
When web data is pushed into BI systems too early, teams encounter:
- Conflicting metrics across reports
- Inconsistent segmentation logic
- Duplicate entity counts
- Manual fixes inside dashboards
- Frequent recalculation errors
Instead of generating insights, analysts spend time debugging numbers. Decision-grade web data requires that transformation pipelines stabilize before BI integration becomes the primary access layer.
Why readiness must precede visualization
Analytics readiness means:
- Consistent schema definitions
- Unified entity mapping
- Validated derived metrics
- Stable data transformation pipelines
- Documented metric logic
Challenge 8: Insight Generation Lacks Clear Definitions
Why metrics drift across teams
Once web data reaches analytics layers, different teams begin interpreting it in their own ways. Marketing defines growth differently from product. Operations measure performance using alternate logic. Finance applies separate filters.
If metric definitions are not standardized early, insight generation fragments. Turning web data to insights requires consistent definitions tied directly to transformation logic. Without that alignment, the same dataset produces conflicting conclusions.
What inconsistent insight logic creates
When metric definitions vary across teams, organizations see:
- Multiple versions of the same KPI
- Conflicting reports presented to leadership
- Redundant transformation logic built in parallel
- Loss of trust in analytics outputs
- Time spent reconciling numbers instead of acting on them
Decision-grade web data depends on shared semantic understanding, not just structured extraction.
Why definitions must be formalized in pipelines
Insight consistency requires:
- Centralized metric definitions
- Version-controlled transformation rules
- Clear documentation of derived calculations
- Governance over KPI changes
- Alignment between engineering and analytics teams
Challenge 9: Data Transformation Breaks Historical Continuity
Why historical consistency is harder than it looks
Turning web data to insights is not just about today’s dataset. It is about trend stability over time.
As pipelines evolve, fields are redefined. Categories are reclassified. Enrichment rules improve. Normalization logic changes. These improvements are necessary. But without structured version control, historical continuity breaks. Decision-grade web data requires that changes do not invalidate prior insights.
What breaks when continuity is ignored
When transformation pipelines are updated without historical discipline, teams face:
- Sudden shifts in trend lines unrelated to real-world change
- KPI jumps caused by logic updates, not market shifts
- Inconsistent historical backfills
- Difficulty explaining discrepancies to leadership
- Loss of confidence in long-term reporting
The problem is not the improvement. It is the lack of traceability. Web data to insights requires clear versioning of transformation logic and explicit tracking of when changes occurred.
Why versioning is part of insight integrity
Maintaining continuity requires:
- Version-controlled transformation pipelines
- Change logs tied to schema updates
- Clear distinction between data changes and logic changes
- Backward compatibility where possible
- Transparent annotation of methodology shifts
Challenge 10: Insight Ownership Is Not Clearly Defined
Why accountability determines data quality
Even when structured data extraction, normalization, enrichment, validation, and monitoring are implemented, insight quality can still degrade. The missing layer is ownership. Turning web data to insights requires clear accountability for data transformation pipelines, metric definitions, validation thresholds, and BI integration standards. When ownership is ambiguous, issues persist longer and improvements move slowly.
Decision-grade web data is not only a technical output. It is an organizational responsibility.
What happens without defined ownership
When ownership is unclear, teams experience:
- Delayed responses to data quality monitoring alerts
- Disagreements over metric definitions
- Uncoordinated pipeline updates
- Inconsistent entity resolution rules
- Conflicting interpretations of insight outputs
Web data to insights breaks down when everyone consumes the data but no one governs its structure.
Why ownership formalizes insight reliability
To maintain decision-grade web data, organizations must define:
- A clear owner for data normalization and schema changes
- Accountability for data validation rules
- A review process for metric updates
- A governance model for insight generation
- Alignment between engineering, analytics, and business teams
What Ownership Failure Looks Like in Practice
A data quality monitoring alert triggers a spike in null values for a key pricing field.
- Analytics assumes ingestion error.
- Engineering assumes a normalization bug.
- Product assumes temporary source issue.
No team owns the metric definition or the validation threshold. The issue lingers for days. Reports remain inconsistent. Leadership decisions are delayed. Without defined ownership, decision-grade web data erodes not because systems fail — but because accountability diffuses.
Summary of the challenges
| Challenge | What breaks | Why it blocks web data to insights | What “decision-grade web data” needs |
| 1. Raw extraction is not analytics-ready | Inconsistent formats, units, categories | Dashboards compare unlike values | Data normalization into a unified schema |
| 2. Entity resolution becomes a bottleneck | Duplicates, fragmented entities | Counts and trends are inflated or split | Entity resolution with strong matching rules |
| 3. Enrichment treated as optional | Missing context for segmentation | Analysts build ad hoc logic in BI | Data enrichment embedded in the pipeline |
| 4. Validation implemented too late | Bad values propagate downstream | Errors surface after stakeholders notice | Data validation gates before consumption |
| 5. Transformation pipelines overcomplicate | Brittle, slow, hard to change | Pipeline updates break reports | Modular, versioned transformation pipelines |
| 6. Quality monitoring not continuous | Gradual drift goes unnoticed | Insights degrade over time | Data quality monitoring with baselines |
| 7. BI integration before readiness | Dashboards expose inconsistencies | BI becomes a patch layer | Analytics readiness before BI integration |
| 8. Insight definitions are inconsistent | Multiple KPI versions | Teams disagree on “truth” | Centralized metric definitions in code |
| 9. Historical continuity breaks | Trend lines shift due to logic changes | Leaders lose trust in history | Versioned logic + transparent methodology changes |
| 10. Ownership is unclear | Slow fixes, conflicting standards | Nobody governs reliability | Clear owners for pipelines, rules, and KPIs |
Web data to insights is a pipeline discipline, not a reporting exercise
Most organizations underestimate the distance between collected web data and decision-grade web data.
Extraction feels like progress. Dashboards feel like visibility. But neither guarantees reliability.
Turning web data to insights requires structural discipline across normalization, enrichment, validation, entity resolution, transformation pipelines, and monitoring. Each layer protects the next. If one layer is weak, insight generation becomes fragile.
The biggest misconception is that insights emerge naturally from structured data extraction. They do not. Insights emerge from consistent semantics, stable transformation logic, continuous data quality monitoring, and clear ownership.
Decision-grade web data is defined by what it prevents, not just what it produces. It prevents duplicate entities from distorting counts. It prevents inconsistent units from corrupting comparisons. It prevents silent drift from undermining trend lines. It prevents BI integration from becoming a patch layer.
The real challenge is not technical complexity. It is operational maturity.
When teams treat analytics readiness as a formal requirement rather than an assumption, the pipeline changes. Validation happens before visualization. Versioning protects historical continuity. Metric definitions are formalized in code, not in slide decks. Governance becomes explicit.
Web data to insights is achievable, but only when the pipeline is designed to support decisions rather than just data collection.
If your organization depends on external data for forecasting, pricing, hiring analytics, or competitive benchmarking, the quality of your insights will always reflect the discipline of your data architecture.
What separates successful teams is pipeline discipline. They operationalize validation, enrichment, and versioned transformation logic so insights stay consistent over time. This is why strategic web data insights and analytics requires analytics-ready data foundations and measurable data quality monitoring. Organizations reaching this realization often evaluate whether their current web data pipeline is truly decision-grade.
Get structured Booking.com review datasets to track sentiment, identify service gaps, and benchmark competitors.
If you want to go deeper
- How small businesses use AI successfully – Shows how structured, analytics-ready data supports practical AI applications.
- Using recruitment analytics to improve hiring – Explains how decision-grade web data strengthens hiring intelligence.
- How ecommerce capitalizes on data scraping services – Demonstrates how normalized and enriched web data drives pricing and strategy.
- Ecommerce data science projects in practice – Highlights how reliable transformation pipelines enable accurate analytics.
The Harvard Business Review article The Big Data: Management Revolution explains why organizations fail when they treat data accumulation as equivalent to insight generation. It reinforces the importance of disciplined interpretation and structured analysis.
These challenges arise specifically when the raw input is web-scraped data — not stable database exports or governed APIs; where source volatility, structural inconsistency, and schema drift are constants rather than exceptions.
FAQs
1. What does it mean to turn web data to insights?
It means transforming raw scraped data into normalized, validated, enriched, and analytics-ready datasets that can support reliable business decisions.
2. What makes web data decision-grade?
Decision-grade web data is consistent across sources, validated for quality, version-controlled over time, and integrated into structured transformation pipelines.
3. Why is data normalization critical for insight generation?
Without data normalization, values across sources cannot be compared reliably. Inconsistent formats and labels distort analysis and trend reporting.
4. How does entity resolution improve analytics readiness?
Entity resolution prevents duplicate or fragmented representations of the same entity, ensuring accurate counts, segmentation, and benchmarking.
5. Why is continuous data quality monitoring necessary?
Web sources change over time. Continuous monitoring detects drift, null creep, and structural shifts before they corrupt insight generation workflows.