
**TL;DR**
The U.S. housing market is always shifting, sometimes slowly, other times all at once. If you’re working in real estate or doing some kind of financial research, you probably know the pain of relying on outdated data. Weekly housing reports, like the ones Redfin and Zillow put out, are a better bet. They give you fresher numbers on things like prices, listings, and how long homes are taking to sell right now, not a month ago.
The catch? Getting that data manually is an absolute grind. One mistake, one missed update, and your whole analysis could be off. That’s where web crawlers come in. They do the heavy lifting, grabbing data regularly and organizing it. At PromptCloud, we’ve built tools that pull this kind of data in automatically, week after week, so you’re not stuck downloading spreadsheets or clicking through listing pages. You get what you need, when you need it.
Why the U.S. Housing Market Needs Constant Watching
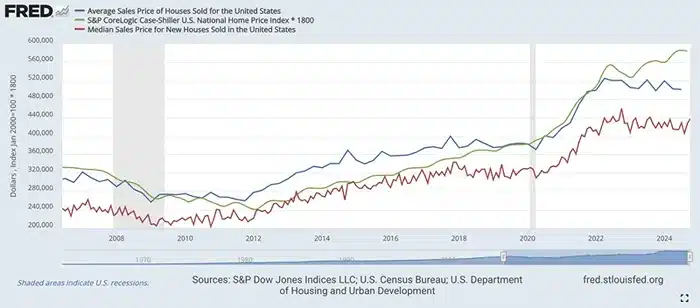
Image Source: Business Insider
The housing market doesn’t sit still. One week you’re seeing bidding wars, the next week sellers are cutting prices. Interest rates change, inventory shifts, and suddenly what worked last month doesn’t work anymore. Anyone dealing with real estate – whether you’re analyzing trends, building platforms, or advising clients – knows this reality well.
Here’s the thing about housing data: if it’s old, it’s not that useful. Monthly reports come out weeks after the fact. By then, you’re looking at what happened, not what’s happening right now. That lag time can cost you opportunities or lead to decisions based on outdated assumptions.
Weekly housing market data changes this equation completely. Companies like Redfin and Zillow publish fresh numbers every week. New listings, price changes, how long homes stay on the market – all updated regularly. This frequency gives you a much clearer picture of where things are headed instead of where they’ve been.
But there’s a practical problem. Getting this data manually is a hassle. Sure, you can visit websites, download files, copy numbers into spreadsheets. That works fine when you’re tracking one market or doing occasional research. Scale that up to multiple cities, multiple data sources, every single week? Now you’re spending half your time just collecting information instead of analyzing it.
That’s where web crawler technology makes sense. Instead of manual collection with all its delays and potential errors, you can automate the whole process. PromptCloud’s web crawling services handle this exact challenge – pulling housing data from multiple sources, cleaning it up, and delivering it on schedule. No missed updates, no formatting headaches, no time wasted on data collection tasks.
If you’ve ever tried to make sense of weekly housing data, you know it can be tricky. This guide breaks down what’s going on, which numbers are worth paying attention to, and how using automation can help you keep up without burning out. Whether you’re keeping an eye on trends for investing or putting together data tools for clients, getting familiar with how this stuff works can give you a leg up.
What Is Weekly Housing Market Data?
Here’s the thing about housing data—by the time most reports get into your inbox, what’s happening out there might look pretty different. If you work in real estate, maybe you’ve had this experience: You finally get that big monthly market summary, but all the interesting stuff—the spike in new listings, the dip in buyer activity—started three weeks ago, and nobody told you in time.
That’s why those weekly datasets from sites like Redfin and Zillow have become such a big deal. Unlike the old-school schedule, here you’re seeing, every seven days or so, what’s new: How many homes went up for sale, whether sellers are dropping prices because their listings aren’t moving, or how long stuff is sitting before someone makes an offer. Maybe it’s a few hundred homes this week instead of a thousand last time, but that swing will shape daily decisions—from pricing to investment.
What counts is granularity. Weekly updates pull the curtain back so much sooner. You spot the weird trends and the quick changes—sometimes before they show up anywhere else. For anyone whose job is to track, predict, or consult on what comes next, it’s the difference between reading yesterday’s news and knowing what’s shifting right now.
Of course, none of this means the data is always perfectly clean or easy to use. Redfin housing data and Zillow housing data come in with their quirks. But getting early signals, even if you still have to work through some noise, is valuable. Imagine advising a client or making a buy decision with this week’s numbers, not last month’s. It puts you ahead, plain and simple.
Why Weekly Housing Data Matters for Real Estate Decisions
Anyone working in real estate knows the market doesn’t wait around. Things change fast, and if you’re still working with last month’s numbers, you’re already behind. Here’s why getting housing data every week instead of every month can make such a difference.
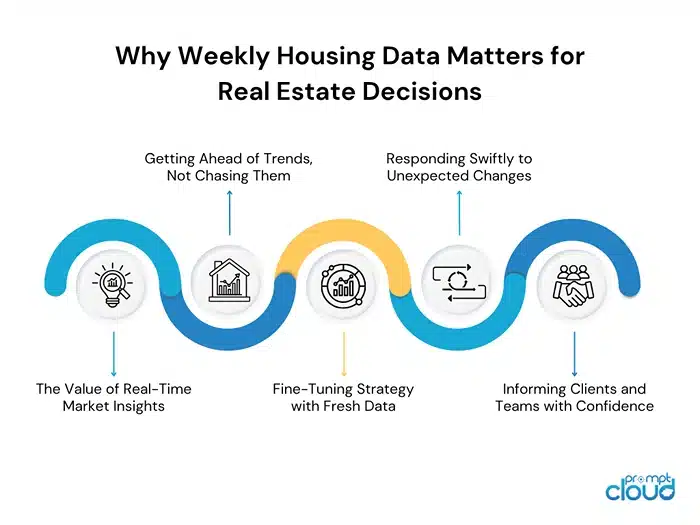
The Value of Real-Time Market Insights
Here’s a scenario that probably sounds familiar: you’re advising a client on pricing, but your data is three weeks old. Meanwhile, the market has shifted. Maybe inventory jumped, or buyers started pulling back. With weekly updates, you’re not guessing what might have changed – you know what did change, and when.
Getting Ahead of Trends, Not Chasing Them
Markets don’t move in neat monthly chunks. Sometimes you get warning signs – like homes sitting longer, or more price cuts showing up – weeks before anyone else notices. If you’re tracking these signals weekly, you catch the shift early. Your competitors using monthly data? They’re still operating on old assumptions while you’re already adjusting.
Fine-Tuning Strategy with Fresh Data
Strategy works best when you can make small adjustments instead of big corrections. Say you notice new listings dropped for two weeks straight, or pending sales are climbing faster than expected. You can tweak your approach right away – change pricing recommendations, adjust marketing tactics, or reallocate resources. No need to wait for the “official” monthly report to confirm what you already suspected.
Responding Swiftly to Unexpected Changes
Interest rates jump. New regulations get announced. Economic news hits. These events can change buyer behavior overnight. Weekly data lets you see the actual impact, not just speculate about it. Maybe open house traffic drops immediately, or price cuts suddenly increase. You can adjust your advice and strategy while the change is still fresh, not weeks after everyone else has figured it out.
Informing Clients and Teams with Confidence
Nothing kills credibility like outdated information. When someone asks what’s happening in the market, you want to answer with this week’s reality, not last month’s history. Fresh numbers back up your recommendations and show you’re on top of current conditions. Your clients and colleagues notice the difference.
Working with weekly housing data isn’t about having more numbers to analyze. It’s about timing your decisions better, spotting changes sooner, and staying ahead of a market that moves faster than most people realize.
Leading Sources: Redfin & Zillow’s Weekly Housing Market Data
If you spend any time following the U.S. housing market, you’ll run into data from Redfin and Zillow sooner or later. These two outfits are the main players when it comes to reliable, up-to-date information on what’s happening week to week—from new listings to how quickly homes are selling.
Redfin Weekly Housing Data
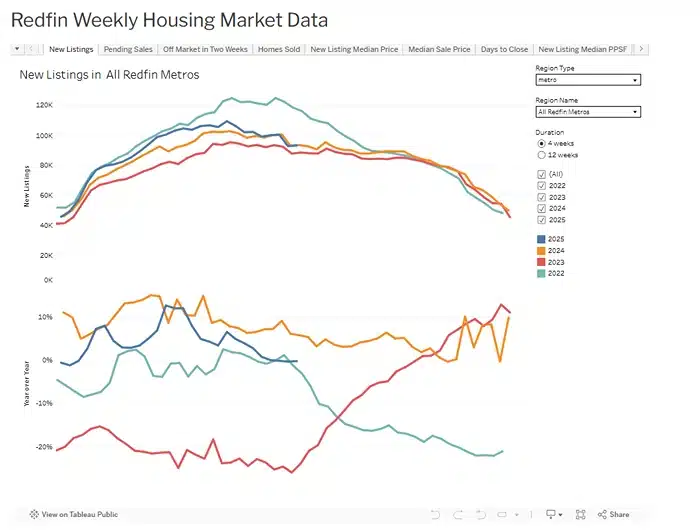
Image Source: redfin
Redfin’s strength is speed and scope. They pull from multiple listing services and keep their figures current. Every single week you’ll see updated stats: home prices, inventory, listings added, and days on market. In June 2025, for example, median home prices nationwide stood at $447,435, which marked a 1.1% jump over the year before. Around 2,057,937 homes were listed for sale at that time, up 12% compared to the same period in the previous year. The median days on market ticked up to 39, which is about six days longer than the previous year.
Redfin’s reports don’t just offer broad overviews; they’re detailed down to individual metro areas and neighborhoods. If you want to keep tabs on local shifts or spot a trend before it reaches national headlines, this is the place to look. They update every Wednesday, so you’re never far behind the latest developments.
Zillow Weekly Housing Data
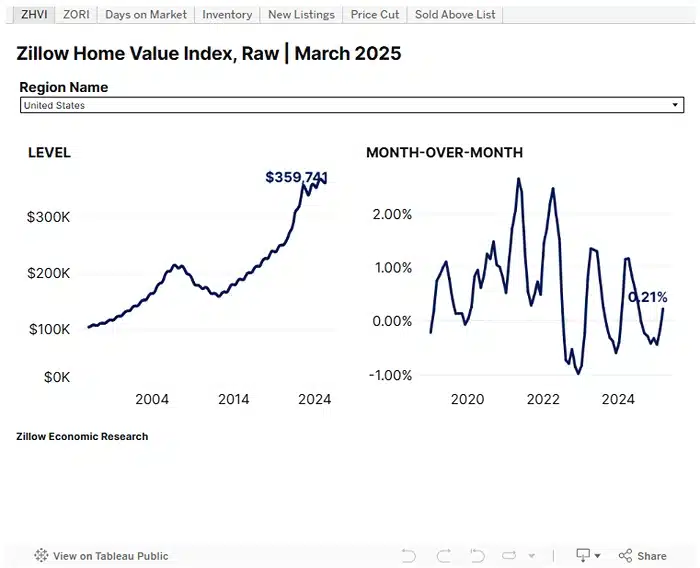
Image Source: Zillow
Zillow, on the other hand, shines when it comes to variety and forecasting. Besides home price indexes and inventory, they offer projections for both sales and rent rates. According to their May 2025 numbers, U.S. housing inventory was up almost 20% from the previous year. Right around that time, buyer competition hit the lowest point since before 2020. The national average home value hovered at $369,147 in July 2025, and Zillow’s forecast suggested a slight dip, about 0.7% between May 2025 and May 2026.
What sets Zillow apart is that their reports don’t just track what has happened; they adjust forecasts week by week. Their Home Value Index lets users compare cities, counties, and neighborhoods, so you can see in real time if prices are holding steady, rising, or dropping—not just after the fact.
Why It Pays to Track Both
Both Redfin and Zillow release their numbers quickly, which makes a big difference for anyone who’s investing, advising, or analyzing in real estate. Instead of waiting weeks for official summaries, you can see trends forming almost immediately. When every week brings something new—shifts in supply, price changes, spikes in days on market—timely updates from these platforms mean you’re making decisions with fresh facts.
If you’re trying to get ahead in this business, these weekly reports from Redfin and Zillow help you move before everyone else catches on. The result? Less guesswork and better calls, week by week.
Breaking Down Key Metrics in Weekly Housing Reports
If you’ve ever sorted through a weekly market update, you know it can feel like a pile of numbers. Here’s how you can look at the stats, none of the fancy phrasing, just what matters and why you should be tracking them.
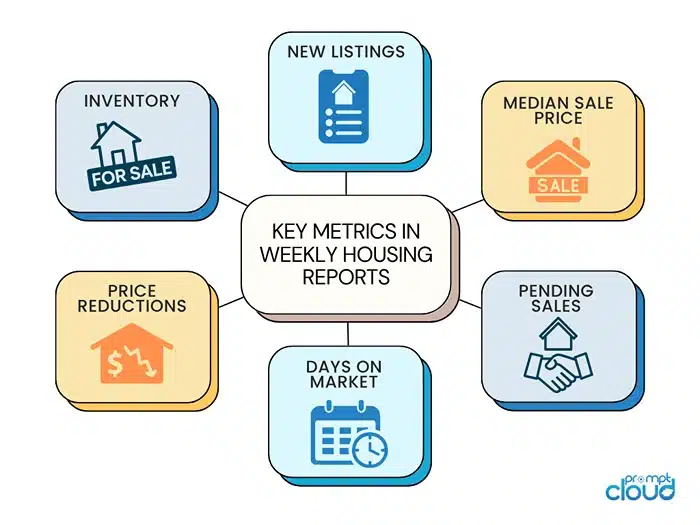
New Listings
How many homes hit the market this week? That simple question can tell you if sellers are feeling optimistic. If the number is climbing for a few weeks, you’ll usually brace for more choices and maybe a little less competition. On the other hand, when new listings dry up, things get tight fast—buyers start fighting over scraps, and prices can hold firm or even tick up.
Median Sale Price
Most folks want to know about the “average” price, but honestly, the median is more useful—you don’t get thrown off by the occasional mansion skewing the results. Tracking this week by week, you’re watching for a run of gains or a few weeks of declines in a row. One wild jump or drop? Ignore it. But trends that build over several updates usually tell the truth.
Pending Sales
These numbers are like reading the market’s mind a few weeks before deals close. High pending sales mean buyers are still writing offers; a slowdown here usually shows up as weak closing numbers down the line. So, when you see pending sales stalling, you know to prepare for softer reports next.
Days on Market
This is just how long a house sits before getting an accepted offer. When homes sell in under two weeks, you know buyers are anxious and sellers have power. When days creep up toward a month or more, it tells me buyers are cooling off. Try to pair this metric with price cuts to really understand what’s shifting.
Price Reductions
Price drops say more about seller reality checks than almost anything else. If you see lots of price cuts so far this summer, sellers might have started too high or demand tapered off. Never look at this metric alone, but big changes usually mean something’s up.
Inventory
Total active homes for sale—the “what’s left on the shelves.” Growing inventory with few new listings? Stuff isn’t moving. Less inventory, more new listings? Maybe homes are finally selling. This one, combined with everything else, gives you a gut-check on market balance.
If you’re just staring at numbers in a report, it’s a pain to connect the dots. When you track weekly housing data, you’re hunting for movement: Is there momentum? Did something stall? Are sellers blinking first, or buyers? It’s never just about single weeks, either—it’s what keeps repeating that actually means something.
Challenges of Collecting Weekly Housing Data Manually
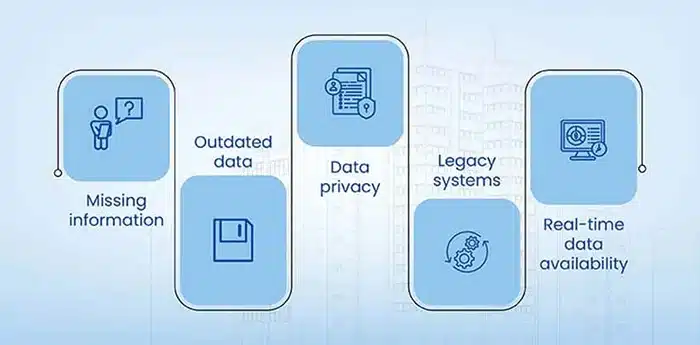
Image Source: HitechDigital
If you’ve ever tried to gather weekly housing data on your own, you know how easy it is to underestimate just how much labor goes into the process. The numbers don’t just appear in your inbox, and it’s not one quick search and you’re done. If you’ve been there, you probably remember how quickly things get out of hand.
First off, you’re not just pulling a few stats from one place. Redfin, Zillow, local listing services—every source has its format, its quirks, and a new report coming out pretty much every week. There’s a brutal rhythm to it: download the latest spreadsheet, check if their column headers changed, make sure last week’s data lines up with this week’s. If the site structure or file format shifts (it happens), you’re scrambling to fix broken formulas.
You’ll also realize how prone the whole process is to mistakes. Miss a week, and you’ve got a hole in your timeline. Copy a number wrong, and there’s a risk it throws off your analysis—maybe without you even noticing right away. And as you pile up the weeks, the spreadsheets balloon, with each additional city or region multiplying the work.
All this assumes you’ve got just one market you care about. Scale it to five, ten, fifty, or more? You’re either spending whole days collecting, cleaning, and wrangling that data—or dropping the idea of weekly coverage altogether. Things slip through the cracks. Updates get skipped. Before long, the freshness and quality that make weekly housing data valuable are gone.
In the end, most people who try to keep up with manual data collection eventually look for a better way. That’s where automation and web crawlers step in, which is what we’ll tackle in the next section.
Automating Housing Data Collection with Web Crawlers
At some point, nearly everyone who tracks housing numbers by hand starts to wonder if there’s a smarter approach. That’s where web crawlers come in. What are they, in plain English? Think of them as digital assistants that do the boring parts of your job: searching, copying, and organizing the latest numbers, but nonstop—week after week—without ever missing a release or messing up a formula.
A web crawler is just a bit of tech that scans websites for you. It visits Redfin, Zillow, or whichever public sources you want, grabs the info you care about (prices, inventory, listings, etc.), and puts it all in a tidy format. If Redfin publishes new market stats each Wednesday morning, your crawler can be set up to grab those figures right after they go live—no more setting calendar alerts or waiting for downloads.
The big difference is scale and reliability. One person, maybe they can handle manual collection for a single city every week. A crawler can keep that up for dozens, even hundreds, of locations at once. You can build out broad, multi-market datasets and always be running with fresh info.
Automation also cuts down on errors. Crawlers don’t skip a week, transpose numbers, or forget to archive old files. They work rain or shine, updating your data right on schedule. And if something on the source site changes—a new page layout or a different download link—you get an alert to adjust quickly, not a pile of broken files you find days later.
If your business depends on making sense of current housing activity, moving to a web crawler setup isn’t about showing off fancy tech. It’s just about making sure your process for tracking market data is fast, repeatable, and less likely to let things slip through the cracks. That’s the real advantage: your time and attention end up focused on analyzing the numbers, not chasing them down week after week.
PromptCloud’s Web Crawling Services for Housing Market Data
If you’ve gotten this far, you already know how much easier life gets when you automate collecting housing market stats. That’s where PromptCloud steps in. Rather than settling for generic, one-size-fits-all feeds or spending hours reinventing the wheel, PromptCloud builds custom web crawler setups designed with real estate data in mind.
What does this look like day to day? Say you want fresh weekly Redfin housing data for ten metro areas, or maybe Zillow housing data broken down by neighborhood, updated every Friday before noon. With PromptCloud, you just set the rules. The crawler visits those sources on schedule, grabs the latest numbers—new listings, median prices, inventory, whatever you need—and cleans them up so you’re not untangling messy files or fixing column errors. Your output comes in ready-to-analyze formats like CSV or JSON, dropped straight into your workflow.
There’s another perk: PromptCloud keeps an eye on source changes. If Redfin tweaks its data page, or Zillow shifts where weekly stats are posted, you’re not left scrambling. The service monitors these changes and updates the crawler logic, so your feed doesn’t break when a website is updated. That stability is key for anyone running recurring analytics or powering dashboards that clients and teams rely on.
Compliance is part of the package, too. PromptCloud’s crawlers respect robots.txt and work within the rules of public data access, so you’re not rolling the dice with risky or unreliable scraping hacks. This continues to matter as more platforms lock down or adjust the way they share housing data.
Ultimately, PromptCloud’s service means more focus on analysis and decision-making—less on wrangling messy, inconsistent numbers. For real estate analysts, PropTech companies, or financial researchers who can’t afford to miss a market move, reliable web crawling is the difference between being on time and left behind.
Real-World Impact: Predictive Power and Business Decision-Making
Having fresh, high-frequency housing data on hand doesn’t just make your workflow cleaner—it fundamentally changes how you make calls in the property market. If you’ve worked with quarterly or even monthly summaries, you’ll know how much guessing and late reacting that business involves. With weekly updates, the guesswork fades, and you start seeing market changes before they become headlines.
Picture this: you’re monitoring a string of weeks where price reductions are ticking up and new listings are shrinking in certain zip codes. That might not make the national news for a month or more, but you and your team can spot a local cool-down almost in real time. Developers use this kind of insight to time launches. Investment managers can pull back, diversify, or double down before the numbers confirm the trend more broadly.
Consulting firms and PropTech platforms are also building in forecasting using these feeds. When Redfin reports a sudden drop in days on market in a handful of cities, analysts can tag those places for attention in coming weeks. This early heads-up makes portfolio planning and risk assessments more reliable, and it helps agents and clients avoid costly surprises.
It’s not just about catching downturns, either. Weekly data lets you act on upside, too—say, spotting a surge in pending sales before that heat spills into the broader market. All of these decisions—big or small—get sharper because you can move with the market, not after it.
In short: with granular, up-to-date housing data fueling your dashboards and strategies, your decisions stop being reactive and start getting proactive. That’s a real edge in a business where timing is everything.
Turning Market Movement into Strategic Action
Weekly housing data isn’t just another set of numbers—it’s how professionals stay close to the market without falling behind. Whether it’s spotting cooling demand before it shows up in headlines, or catching shifts in listing volume before your competitors do, the advantage is timing. And timing only works when your data is frequent, reliable, and easy to act on.
Trying to collect and manage this level of data manually? It burns time and increases the odds of slipping behind. Automating the process with web crawlers flips that dynamic entirely. You’re not chasing trends—you’re anticipating them.
At PromptCloud, we help real estate teams, PropTech platforms, and financial analysts turn raw housing data into actionable, always-fresh insights. If your strategy depends on knowing what’s happening now—not last month—our web crawling solutions give you exactly that: fast, clean, consistent housing market data built to fit your needs.
Start tracking U.S. housing trends the smart way. Reach out to us and let’s build your data pipeline.
FAQs
1. What does “weekly housing market data” usually track?
It covers new listings, active inventory, median sale price, pending sales, days on market, and price drops—basically, all the stats that show what’s happening in real time.
2. Why is it risky to only use monthly or quarterly housing data?
By the time you get those numbers, many trends—good or bad—have already played out. You miss early warning signs (or opportunities) and end up playing catch-up.
3. How do web crawlers help with real estate data analysis?
Web crawlers grab data from places like Redfin and Zillow automatically, on whatever schedule you set. That keeps your info current while avoiding manual errors.
4. What if a data source changes its website or format?
A professional crawling setup (like PromptCloud’s) can spot changes on the source site and adjust quickly, instead of leaving you with gaps in your data.
5. Who benefits most from using weekly housing data with automation?
Real estate analysts, PropTech developers, investors, and consultants get the clearest advantage—anyone who needs precise, timely info to make calls, advise clients, or adjust strategy on the fly.