**TL;DR**
Crawler failures rarely look dramatic. They look like slowdowns, partial coverage, missed pages, and jobs that are completed but shouldn’t have. Prometheus and Grafana help only if you stop treating them as dashboards and start using them as control systems.
What is Prometheus and Grafana?
Most crawling systems do not fail loudly. They keep running. Jobs still show as successful. Metrics look green enough to ignore. And yet data quality quietly degrades. Coverage thins. Freshness slips. Downstream teams start compensating without knowing why.
This is where web crawler monitoring usually falls apart. Teams wire up Prometheus because it feels responsible. They add Grafana dashboards because leadership wants visibility. They track uptime and error rates and feel covered.
Then something breaks. Not all at once. Not in a way that triggers alerts. A region slows down. A retry loop spins longer than expected. A scraper starts timing out on dynamic pages. Health checks still pass. The crawler is technically “up”. By the time someone notices, the damage is already baked into the data.
The uncomfortable truth is that most monitoring setups are observational, not corrective. They tell you what happened after it matters. They do not help you recover automatically, and they definitely do not explain what should have happened instead.
This is why scraping observability needs to be designed differently from application observability. Crawlers operate in hostile, variable environments. Failures are partial. Signals are weak. And recovery matters more than visibility. This article is about how teams actually use Prometheus and Grafana to detect crawler failures early, tie those signals to health checks that matter, and trigger auto-recovery before pipelines drift into silent failure.
Many organizations begin web scraping with internal scripts, but maintaining crawler infrastructure, handling anti-bot protections, and monitoring data quality quickly becomes a full-time operational task.
Why crawler failures don’t show up as “down”
Traditional monitoring assumes a simple model.
Service up.
Service down.
Alert when down.
Web crawlers do not behave like that. A crawler can be “up” while skipping pages. Or retrying the same URLs for hours. Or finishing jobs with half the expected coverage. Prometheus happily scrapes metrics. Grafana plots clean lines. Everyone sleeps. Until someone asks why yesterday’s dataset looks thinner.
This happens because most crawler failures are behavioral, not binary. A JavaScript-heavy site starts loading slower in one region. Requests succeed but take twice as long. Your crawler adapts by retrying more aggressively. Error rates stay low. Latency creeps up. Job duration stretches. Coverage drops just enough to matter.
From a monitoring perspective, nothing is broken. This is why uptime tracking alone is a trap for scraping systems. “Up” does not mean “working”. It just means the process is alive. What you actually care about is whether the crawler is behaving the way you expect it to behave.
That expectation is rarely encoded in metrics.
Teams often track:
- process uptime
- HTTP error rates
- total requests sent
They rarely track:
- expected URLs versus scraped URLs
- time spent per crawl stage
- retry depth per target
- completion time drift over time
Without those, Prometheus only tells you that the crawler exists, not that it is healthy. This problem shows up quickly when teams move beyond toy crawlers. Mobile app scraping pipelines, for example, often stay technically alive while silently losing coverage because render timeouts increase but never fail hard. The same thing happens when scaling social or marketplace scrapers, where partial success masks real degradation.
To make web crawler monitoring useful, you have to stop thinking in terms of service health and start thinking in terms of crawl intent.
What did this job promise to deliver?
Did it deliver it on time?
And if not, how far off was it before anyone noticed?
Those questions drive everything that follows.
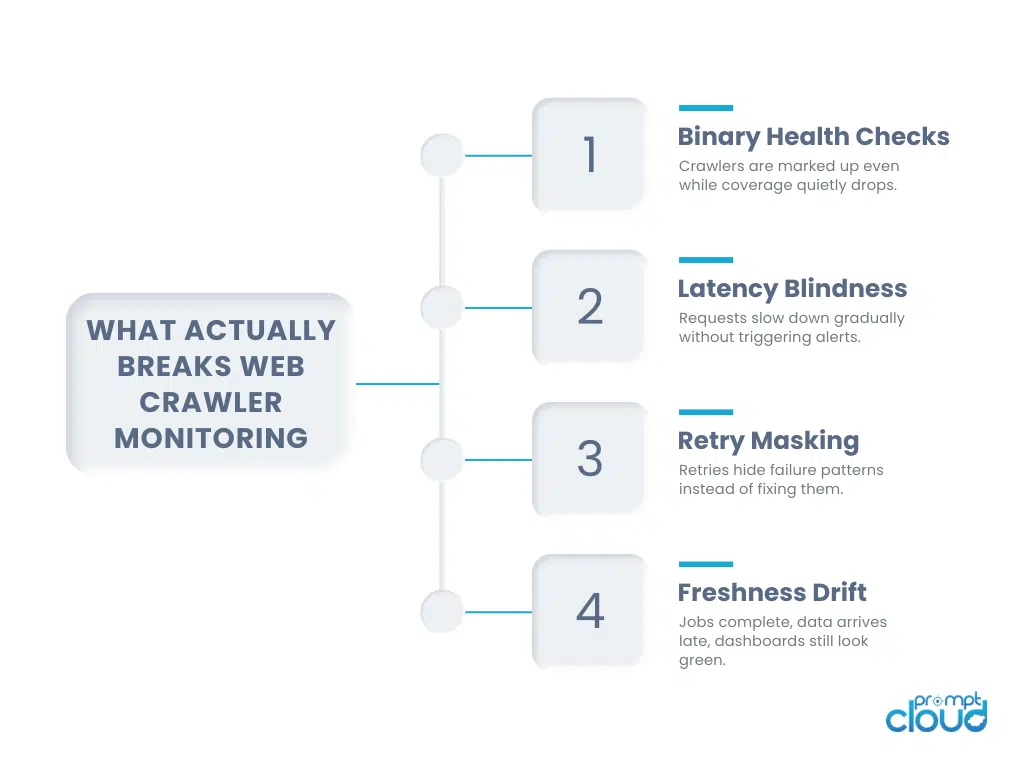
Figure 1: Common failure patterns that cause crawler degradation without triggering traditional uptime alerts.
What meaningful health checks look like for crawlers
A health check that always passes is worse than no health check at all. Most teams implement shallow checks. Is the process running? Is the queue non-empty? Is Prometheus still scraping metrics?
Those checks protect infrastructure, not outcomes. Effective scraping observability starts with outcome-aware health checks. Checks that encode what “good” looks like for a crawl, not just whether something responded. A useful health check answers at least one of these:
Is this crawler progressing at the expected rate?
Is it covering the URLs it is supposed to cover?
Is it slowing down in a way that historically precedes failure?
These checks tend to be indirect. You do not check “is the crawl good”. You check proxies for goodness.
Completion slope instead of completion status. Latency trend instead of latency value. Retry depth distribution instead of retry count. Prometheus is good at collecting these signals because they are numeric and time-series friendly. Grafana is good at showing how they drift.
What teams often miss is that these metrics need baselines. A retry rate of five percent might be fine for one target and catastrophic for another. A ten-minute job might be normal today and alarming tomorrow.
So health checks should almost always be comparative. Today versus yesterday. This run versus the last ten runs. This region versus its own historical behavior. That is where health checks stop being rules and start being memory. Once you have that memory, alerts become more trustworthy. And more importantly, they become actionable. Because now you know what kind of failure you are dealing with, not just that something feels off.
Turning Prometheus from a reporter into an early warning system
Most Prometheus setups are passive by default. They scrape. They store. They expose metrics. Someone looks at them later. That is fine for servers. It is not enough for crawlers. If you want Prometheus to help with web crawler monitoring, you have to change how you think about alerts. Alerts are not for outages. They are for drift.
Drift is the enemy in scraping systems. A crawler that slowly gets worse is far more dangerous than one that crashes. Crashes get attention. Drift gets normalized. So the first shift is this. You stop alerting on absolute values and start alerting on deviation.
Not “latency above X”.
But “latency 40 percent higher than the last seven runs”.
Not “retry count greater than Y”.
But “retry depth distribution shifted compared to baseline”.
Not “job duration exceeded threshold”.
But “job duration trending upward run over run”.
Prometheus supports this style of thinking surprisingly well, if you model the right metrics.
You expose metrics like:
- URLs discovered versus URLs scraped
- Median and tail latency per target
- Retry depth percentiles
- Crawl stage duration breakdowns
Then you use recording rules to turn raw signals into expectations.
Expected URLs per job.
Expected completion time per region.
Expected retry depth for this target.
Once expectations are encoded, alerts become much sharper. They fire when behavior changes, not when things finally fall apart. This is where many teams get uncomfortable. They worry about false positives. They worry about noise. So they raise thresholds until alerts stop firing.
That defeats the point. The goal is not to eliminate alerts. It is to make them meaningful enough that you trust them. When an alert fires, you should already have a strong guess about what is wrong. Slow rendering. Proxy degradation. Region-specific throttling. Queue imbalance. If the alert just says “something bad happened”, it is too late.
Using Grafana to see failure patterns, not snapshots
Grafana dashboards often look impressive. Lots of charts. Lots of colors. Real-time updates. And yet, they rarely answer the one question operators care about.
Is this system getting worse? Single-point views lie. They show you now. Crawling failures develop over time. Effective scraping observability dashboards emphasize comparison.
This run versus last run.
Today versus the same day last week.
This region versus its own historical median.
Grafana is good at this if you resist the urge to overbuild.
Instead of one latency chart, show latency delta from baseline.
Instead of total success rate, show coverage variance.
Instead of absolute retries, show retry depth shift.
When teams do this, patterns jump out quickly. You see the moment when a crawler starts compensating instead of progressing. You see when retries replace throughput. You see when one region quietly drags the whole job down.
This is especially useful in pipelines that scrape dynamic or frequently changing sources. Pricing crawlers, for example, often stay “up” while freshness slips because certain categories slow down first. Without comparative views, that lag goes unnoticed until it affects decisions. The best Grafana dashboards feel boring. They do not scream. They whisper early. And that whisper is what lets you recover before anyone else notices.
Auto-recovery only works when you know what to change
Detecting failure is only half the problem. Recovery is where most systems fall apart. Teams wire alerts to restarts. Or scale-ups. Or blunt reruns. It feels proactive. It often makes things worse. Auto-recovery in crawling systems needs context.
If latency spikes in one region, you do not restart the crawler. You reduce traffic there.
If retries deepen for one target, you do not rerun the job. You back off that target.
If completion time drifts gradually, you do not kill the process. You adjust concurrency.
This is why auto-recovery should be behavioral, not infrastructural. Prometheus alerts should not say “restart pod”. They should say “this dimension is misbehaving”. Then something downstream decides how to react.
That reaction can be as simple as:
- pausing a region
- throttling a target
- draining a queue
- rescheduling unfinished work
The important part is that recovery actions are reversible. You do not want permanent reactions to temporary conditions.
This is also where many teams discover that health checks and recovery logic must evolve together. If your health checks are crude, your recovery actions will be crude. If your checks are nuanced, your recovery can be precise. Prometheus and Grafana do not give you recovery out of the box. They give you signals. What you build on top of those signals determines whether your crawler becomes resilient or just noisy.
Mapping failure signals to the right recovery actions
This is where most scraping observability setups quietly fail.
Teams detect that something is wrong.
They do not know what to do about it.
So recovery defaults to the same blunt tools. Restart the crawler. Rerun the job. Scale up workers. Flush queues. Sometimes that helps. Often it just resets the symptoms without fixing the cause. Effective web crawler monitoring only pays off when failure signals are explicitly mapped to recovery behavior. Not in someone’s head. In the system. You want a tight loop.
Signal appears → classify the failure → apply the smallest possible correction → observe again.
That loop is what turns Prometheus from a metrics store into a control surface. Here is how mature teams usually think about this mapping.
| Failure signal detected | What it usually means | Wrong reaction | Correct recovery action |
| Job completion time drifting upward run over run | Latency increasing or retries compensating silently | Restart the crawler | Reduce concurrency and isolate slow regions |
| Retry depth increasing for a specific target | Target-side throttling or rendering slowdown | Add more retries | Back off the target and cool down requests |
| URLs scraped falling below expected count | Partial coverage due to timeouts or early exits | Rerun the entire job | Reschedule only missing URLs |
| One region shows higher latency than its baseline | Network degradation or geo-specific blocking | Fail over all traffic | Divert traffic away from that region only |
| Health checks pass but freshness SLA misses | Crawl technically succeeded but too slowly | Ignore and move on | Adjust scheduling and concurrency for next run |
What matters here is restraint. The goal is not to “fix” the system aggressively. It is to nudge it back into alignment. Small corrective actions preserve system memory. Big ones wipe it out.
This is especially important in scraping pipelines that feed business decisions. When you overreact, you introduce volatility. Data volumes spike. Gaps appear. Teams downstream lose trust because behavior feels random. When recovery actions are targeted and predictable, something interesting happens. Failures stop feeling scary. They become routine. Engineers stop firefighting and start tuning.
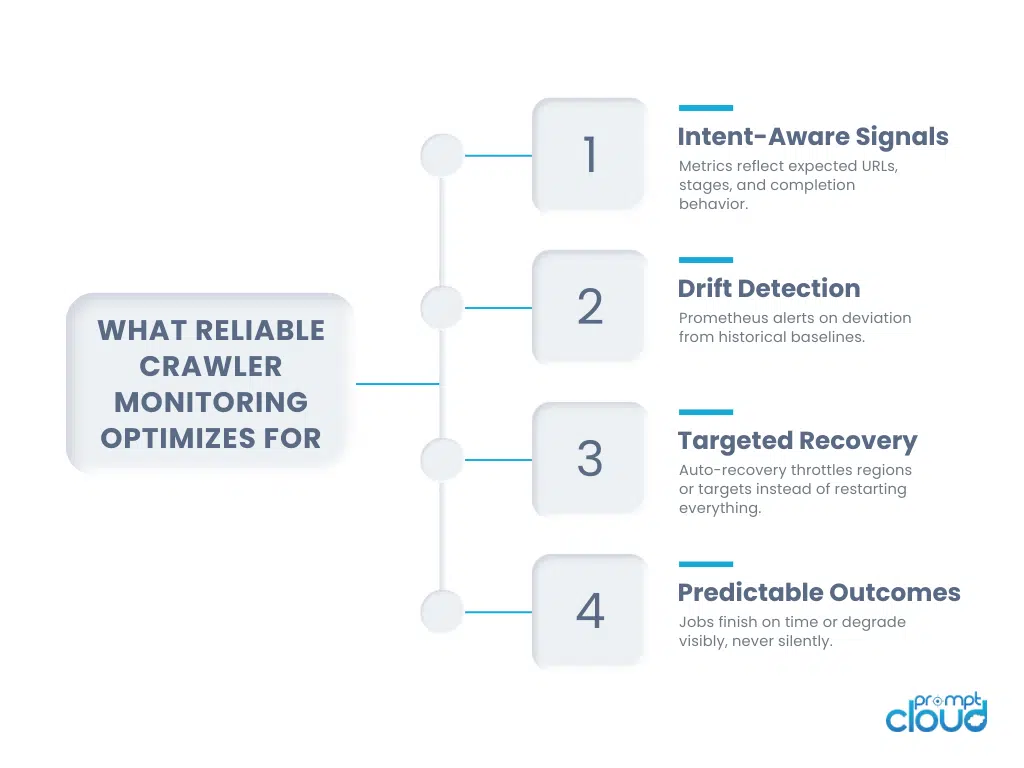
Figure 2: How observability-driven monitoring enables early detection and controlled auto-recovery in crawler pipelines.
Why auto-recovery must be slower than detection
This sounds counterintuitive, but it is critical. Detection should be fast. Recovery should be cautious.
If your system reacts instantly to every signal, it will thrash. One slow spike triggers throttling. Throttling reduces throughput. Reduced throughput triggers freshness alerts. Freshness alerts trigger scaling. Scaling reintroduces load. And you are back where you started. Good auto-recovery systems introduce friction on purpose. They wait a little. They confirm the signal persists. They apply a limited change. They watch the effect.
Prometheus helps here because time is built into the data. You can require that a deviation persists for several scrape intervals. You can compare multiple signals before acting. Grafana helps by making it obvious when the system is stabilizing versus oscillating. This is another place where teams coming from traditional app monitoring struggle. In apps, fast recovery is good. In crawling, fast recovery can amplify instability.
Scraping observability rewards patience. You want to recover before data quality collapses, but after you are confident the signal is real. That balance is the difference between automation that helps and automation that gets disabled after one bad night.
When monitoring changes how teams design crawlers
Once teams get serious about web crawler monitoring, something subtle happens. They stop designing crawlers as one-shot executors. They start designing them as long-lived systems.
Early-stage crawlers are optimistic. They assume targets behave. They assume retries fix things. They assume failures are rare and obvious. Observable crawlers are cautious. They assume targets will change behavior mid-run. They assume regions will degrade without warning. They assume partial failure is the default state, not the exception.
This changes architecture decisions upstream. Crawlers get broken into stages that can be measured independently. Discovery stops being tied to extraction. Rendering stops blocking the whole job. Queues become visible instead of implicit. Retry logic becomes a first-class metric, not a side effect.
Health checks stop being binary. They become expectations encoded in code and metrics.
You see this clearly in teams that scale beyond simple scripts. The moment a Python scraper turns into a scheduled pipeline, observability becomes the difference between something you trust and something you constantly babysit. That is why production teams rarely treat monitoring as an add-on. It reshapes how crawling logic is written in the first place.
The same shift happens when crawling feeds sensitive or time-bound use cases. In pricing pipelines or market monitoring systems, a job that finishes late can be worse than a job that fails. Monitoring exposes that reality quickly, and forces teams to design for timeliness, not just completion.
The limits of dashboards and where humans still matter
There is a temptation to believe that enough metrics will save you. They will not. Metrics tell you that something changed. They do not always tell you why. And they certainly do not decide what tradeoff is acceptable at that moment.
There will always be cases where the system is doing exactly what it was told, and it is still wrong for the business context. A crawler backing off aggressively might protect infrastructure while missing a critical update window. A region being deprioritized might stabilize jobs while losing coverage in a high-value market. These are not technical failures. They are judgment calls.
Good scraping observability makes those calls visible.
It gives operators enough signal to intervene with intent instead of panic. It shows them when auto-recovery helped and when it masked a deeper issue. It shortens the feedback loop between crawling behavior and business impact. This is also why mature teams do not chase perfect automation. They chase explainable automation.
They want to know why the system reacted.
They want to know what it changed.
They want to know whether that change stuck.
Prometheus and Grafana support this mindset well because they preserve history. You can look back and see the moment a crawl started drifting. You can see the recovery kick in. You can see whether it actually helped. That history is often more valuable than the alert itself.
What reliable scraping observability actually buys you
At some point, teams realize they are no longer talking about monitoring. They are talking about trust.
Trust that yesterday’s data is comparable to today’s.
Trust that missing data is intentional, not accidental.
Trust that when something goes wrong, the system will slow down before it lies.
That trust compounds.
Engineers stop overbuilding safety margins. Product teams stop second-guessing numbers. Analysts stop writing defensive queries. Decisions get made faster because fewer people feel the need to validate the pipeline before trusting the output. This is the quiet payoff of good web crawler monitoring.
Not fewer alerts.
Not prettier dashboards.
But systems that behave predictably under stress.
Prometheus and Grafana can support that outcome. But only if you stop treating them as visualization tools and start treating them as part of the control loop.
Where teams usually end up after the first real incident
The first serious crawler incident changes how teams think. Before it happens, monitoring feels like hygiene. Something you set up because it is expected. A dashboard here. An alert there. Enough to feel covered. After it happens, you realize how thin that coverage was.
You replay the timeline. The crawl did not fail. It slowed down. Retries increased. Coverage dipped just enough to matter. Health checks passed. Alerts stayed quiet. By the time someone noticed, the data had already moved downstream and decisions had already been made. That moment is usually when teams stop asking “what metric should we add” and start asking “what behavior should never surprise us again”.
That is the real shift. Web crawler monitoring stops being about visibility and starts being about intent. About encoding expectations into the system. About teaching it what normal looks like so that abnormal stands out early. About deciding which failures deserve automation and which still need human judgment.
Prometheus and Grafana are useful here not because they are powerful, but because they are honest. They show drift. They preserve history. They force you to confront patterns instead of single events.
But they only work if you let them influence design.
If you treat monitoring as something you add after the crawler is built, you will always be reacting. If you treat it as a constraint while building, you start designing crawlers that explain themselves when they misbehave. That usually leads to calmer systems. Crawlers that slow down instead of panicking. Pipelines that shed load intentionally instead of collapsing. Recovery actions that are reversible instead of destructive. And perhaps most importantly, teams that trust their data again.
Not because failures stopped happening. But because failures stopped hiding. That is the quiet goal of scraping observability. Not perfection. Predictability. When monitoring becomes part of the control loop, failures stop being postmortems and start being feedback. And systems that learn from feedback tend to last longer than systems that only chase uptime.
If you want to go deeper
- Why mobile app scraping fails quietly at scale – How rendering delays and retries distort crawler health signals.
- When Python scrapers become production systems – What changes once scripts turn into monitored pipelines.
- How unreliable data pipelines create hidden risk – Why silent failures matter more than visible outages.
- Why freshness matters more than uptime in pricing crawlers – How monitoring drift affects time-sensitive data.
Alerting on symptoms rather than causes – This explains why alerts should trigger on observable impact, not raw metrics, which is the same principle behind effective crawler health checks and auto-recovery logic.
Many organizations begin web scraping with internal scripts, but maintaining crawler infrastructure, handling anti-bot protections, and monitoring data quality quickly becomes a full-time operational task.
FAQs
Why is web crawler monitoring harder than monitoring normal applications?
Because crawlers fail gradually, not cleanly. They slow down, lose coverage, or miss freshness targets while still appearing “up” to traditional uptime checks.
What signals matter most for scraping observability?
Completion time drift, coverage versus expectation, retry depth, and region-level latency trends. These expose behavioral failures long before error rates spike.
Can Prometheus handle crawler-specific monitoring without heavy customization?
Yes, if you expose intent-aware metrics instead of generic ones. Prometheus works well once you stop treating crawls like stateless services.
When should auto-recovery trigger instead of human intervention?
Auto-recovery works best for repeatable, reversible actions like throttling, region isolation, or rescheduling missed URLs. Strategic tradeoffs still need human judgment.
Is uptime tracking still useful for crawlers at all?
Only as a baseline. Uptime tells you the process is alive, not whether the crawl delivered usable data on time.