Why Data Quality Should Be a Priority for Every Business
Every business today runs on data. Whether you’re a retailer adjusting prices, a fintech company detecting fraud, or a logistics provider tracking shipments, data is the fuel behind every decision. But here’s the thing: if your data is messy, missing, or just plain wrong, it doesn’t matter how advanced your tools are—you’re still flying blind.
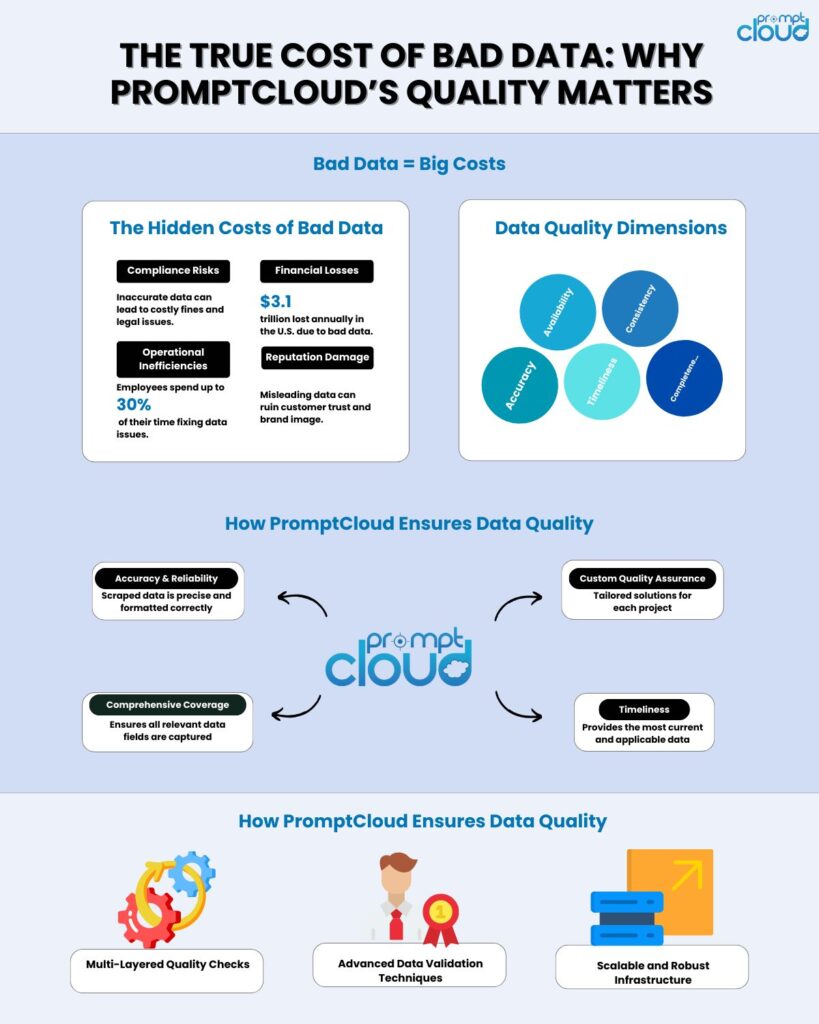
In fact, bad data costs companies a lot more than most people realize. A study by Gartner found that poor data quality costs organizations an average of $12.9 million every year. That’s not just a few errors in a spreadsheet. That’s lost revenue, failed campaigns, and decisions that miss the mark.
So, what’s the solution? It starts with knowing how good—or bad—your data actually is. That’s where data quality metrics come into play.
These aren’t just technical checkboxes. They’re the standards that tell you if your data is usable, trustworthy, and worth acting on. And if your team depends on data to make decisions (which, let’s face it, almost everyone does now), tracking these metrics isn’t optional. It’s essential.
In this article, we’re going to break it all down—what data quality metrics are, why they matter, how to measure them, and how we at PromptCloud make sure the data we deliver checks every box. Let’s get into it.
What Are Data Quality Metrics, Really?
Let’s not overcomplicate it. Data quality metrics are just a set of standards you use to figure out if your data is actually any good. They help answer questions like:
- Can I trust this data?
- Is anything missing?
- Is it up to date?
- Is it formatted the way I need it?
Think of them like a report card for your data. You’re not just looking at one thing—you’re checking for several traits that, together, tell you how reliable your dataset really is.
So, why do businesses even bother with these metrics?
Because decisions are only as good as the data behind them. If your marketing team is using outdated contact lists, your campaign fails before it begins. If your pricing model runs on inconsistent competitor data, your strategy is off balance. These metrics act as your early warning system. They help you spot problems before they snowball into bigger issues.
Businesses use data quality metrics in all kinds of ways—some track them automatically through dashboards, while others use scripts to audit and clean data regularly. However it’s done, the goal is always the same: make sure the data feeding your analytics, models, and decisions is solid.
And the truth is, when you’re working with external data sources (like scraped data from websites or third-party platforms), having clear data quality metrics becomes even more important. That’s one of the key reasons we at PromptCloud build them into every step of our data delivery process—but more on that later.
First, let’s dig into the specific metrics you should be paying attention to.
Key Data Quality Metrics and Why They Actually Matter
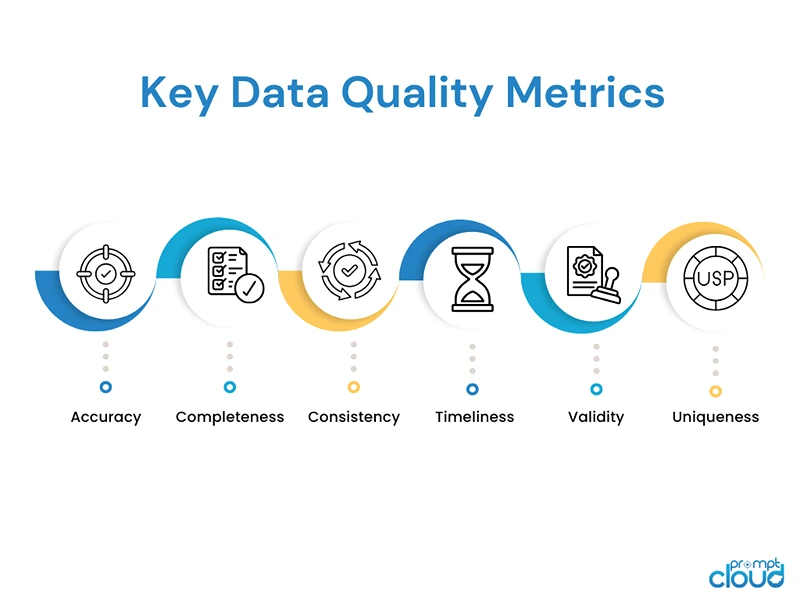
Now that we know what data quality metrics are, let’s talk about the big ones. These are the core metrics that tell you whether your data is useful or just taking up space. Each one looks at a different aspect of quality, and together, they give you the full picture.
1. Accuracy
This one’s simple. Is the data correct? If your dataset says someone bought 15 items but they actually bought 5, that’s a problem. Accuracy is about how closely your data reflects the real world. For example, if you’re scraping product prices from a competitor’s site, and the numbers are wrong—even by a little—it can throw off your entire pricing strategy.
When accuracy drops, so does trust. And once your team or your clients stop trusting the data, they stop using it. That’s why this metric is always at the top of the list.
2. Completeness
Have you ever opened a spreadsheet only to find half the fields empty? That’s what we’re talking about here. Completeness measures whether all the expected data is present. Missing values can mess with your analysis, cause errors in models, or just waste time when someone has to fill in the gaps manually.
Let’s say you’re pulling product reviews from e-commerce sites. If you’re missing key info like star ratings or timestamps, the insights you’re trying to get from that data won’t hold much weight. That’s why completeness isn’t just nice to have—it’s essential.
3. Consistency
This is about uniformity. If the same customer shows up with different names or ID numbers in different systems, that’s a consistency issue. Or if one column records dates as “2025/04/08” and another as “08-Apr-25,” things can get messy fast.
Inconsistent data can create serious headaches, especially when you’re merging datasets from multiple sources. Consistency makes your data easier to work with, which means faster, cleaner analysis.
4. Timeliness
Is your data fresh? Or are you working with information that’s weeks—or worse, months—out of date? Timeliness looks at whether data is available when you need it. And in fast-moving industries like finance, retail, or logistics, outdated data can lead to the wrong decisions at the wrong time.
Say you’re tracking in-stock availability from competitor websites. If the data is two days old, you might miss a chance to adjust your offers or boost your ads in real-time. That delay can directly impact revenue.
5. Validity
This checks whether your data follows the right rules or formats. For instance, if a field expects a date and gets “N/A” instead, that’s invalid. Or if a ZIP code field includes letters when it shouldn’t, it creates issues in downstream systems.
Invalid data might sneak through unnoticed, but it often causes problems later—like failed uploads, broken dashboards, or incorrect filters in reports.
6. Uniqueness
Have you ever looked through a dataset and seen the same row appear over and over again? That’s a uniqueness problem. This metric tracks how many duplicate records you have. Duplicates can throw off totals, mess with counts, and mislead your analytics.
If you’re pulling product data from different online sources, for example, and the same item shows up multiple times under slightly different names, you could end up miscalculating inventory trends or pricing patterns.
Each of these data quality metrics gives you a different lens to evaluate your data. And while no dataset is perfect 100% of the time, measuring these regularly helps you get closer to that goal. It also shows your team (and your clients, if you’re providing data externally) that you take quality seriously.
Next up, let’s talk about how you can actually measure these metrics in practice.
How to Measure Data Quality Metrics Without Making It Overly Complicated
It’s one thing to know what the key data quality metrics are. It’s another thing to actually measure them. A lot of teams get stuck here—not because they don’t care about quality, but because they don’t have a clear plan to monitor it.
But here’s the good news: you don’t need a massive data engineering team or fancy tools to start measuring data quality. What you do need is a system that helps you catch issues early and track patterns over time.
Let’s look at how businesses typically go about it.
Start with a Baseline
Before you can improve anything, you need to know where you stand. That means doing an initial audit. You take a sample of your data and run it through checks for accuracy, completeness, validity, and so on. It’s kind of like a health checkup for your data.
This doesn’t have to be high-tech. You can use SQL queries, spreadsheet functions, or Python scripts to check for missing values, duplicates, or out-of-range numbers. The point is to create a baseline you can compare against later.
Use Rules and Logic for Automated Checks
Let’s say you know that your “Price” column should never be negative, or that email fields should always have “@” in them. These are basic rules, but they can catch a ton of issues.
Many teams build simple logic checks into their pipelines. For example:
- “If column A is empty, flag it.”
- “If date format doesn’t match YYYY-MM-DD, reject it.”
- “If two rows have the same unique ID, raise a duplicate alert.”
Tools like Talend, Apache Griffin, or even Google Sheets (for smaller datasets) let you build these checks into your workflow. You can even trigger alerts or log quality scores automatically.
Track Changes Over Time
Data quality isn’t something you fix once and forget about. It shifts over time—especially if you’re pulling in data from external sources or using automated scraping tools. That’s why it helps to track metrics regularly and spot trends.
For example:
- Is the percentage of missing values increasing over time?
- Are new duplicates appearing after a recent data merge?
- Are some fields becoming outdated more quickly than others?
Answering these questions helps you fine-tune your pipelines and prevent small issues from turning into larger ones.
Common Challenges in Measuring Data Quality
Let’s be honest: this stuff isn’t always smooth sailing. Here are a few challenges most teams run into:
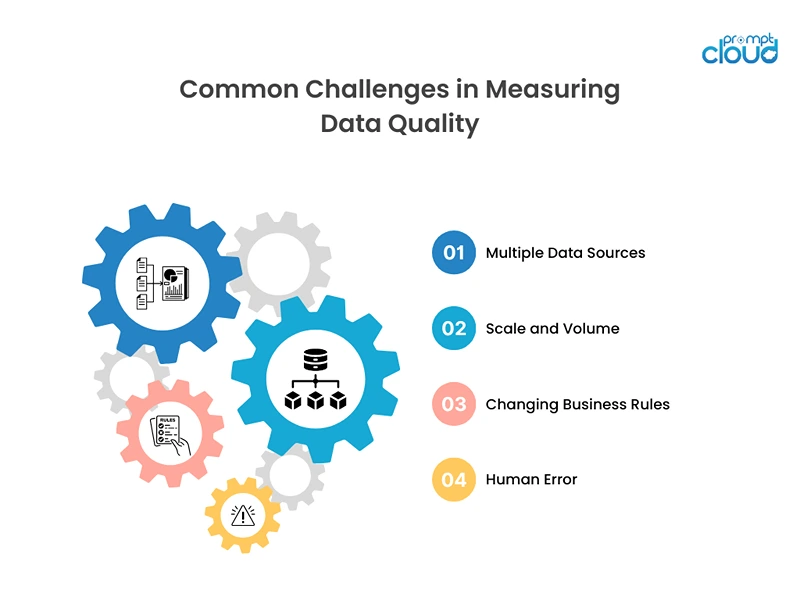
1. Multiple Data Sources:
When data comes from different places—especially unstructured or semi-structured sources—it’s harder to maintain consistency and accuracy. You might find the same product listed under slightly different names, or customer records stored in different formats.
2. Scale and Volume:
Manually checking a few hundred rows is one thing. But what about a few million? As data grows, manual reviews become impossible. That’s where automated validation steps become non-negotiable.
3. Changing Business Rules:
Sometimes, what’s “valid” today won’t be valid tomorrow. For instance, your sales team might start requiring new fields like “campaign source” or “region,” which means your old data now looks incomplete.
4. Human Error:
Even with automation, human input is still part of the picture. Typos, incorrect inputs, or bad formatting can sneak in, especially when teams handle data manually.
The key is not to eliminate every single error (that’s impossible), but to build systems that catch issues early, improve over time, and adapt to change.
And that’s exactly what PromptCloud focuses on when delivering large-scale data to clients across industries.
Next, let’s break down how we do it.
How PromptCloud Ensures High Data Quality Every Step of the Way
We’ve talked about the “what” and the “why” of data quality metrics. But if you’re getting data from external sources—especially scraped from thousands of websites in real time—the question becomes: how do you actually maintain high quality at scale?
That’s where PromptCloud comes in.
We specialize in large-scale web data extraction, and data quality isn’t just a checkbox for us—it’s baked into the workflow. Our clients rely on this data to feed dashboards, power pricing models, train AI systems, and make business decisions. So, if the data isn’t trustworthy, everything falls apart downstream.
Here’s how we make sure that doesn’t happen.
Advanced Web Scraping That Starts With Structure
Before any data even reaches a client, we build custom scraping solutions tailored to their exact requirements. This helps ensure accuracy and completeness right from the source.
We don’t rely on generic templates or cookie-cutter crawlers. Instead, we analyze each website’s structure and set up targeted extraction rules. That means:
- Pulling the exact fields a client needs.
- Avoiding junk data.
- Structuring it all in a consistent, machine-readable format.
By customizing the scraping process, we eliminate a huge chunk of the data quality issues other platforms struggle with.
Automated Validation: The Quiet Hero in the Background
Once data is scraped, it’s not immediately shipped. It goes through our automated validation system. This is where we check for:
- Missing fields
- Unexpected formats
- Duplicates
- Invalid values (e.g., negative prices, date mismatches)
These checks run automatically and at scale—because when you’re dealing with millions of rows of data every day, manual review just isn’t realistic.
If something looks off, it gets flagged for correction or re-crawling before it ever reaches your systems.
Built-In Deduplication and Standardization
Uniqueness and consistency are two of the trickiest data quality metrics—especially when you’re collecting data from multiple sources. For example, one site might call a product “iPhone 15 Pro” while another lists it as “Apple iPhone Pro 15.”
Our system identifies these overlaps using smart matching techniques and ensures deduplication happens before delivery. We also normalize data—like standardizing date formats, converting currencies if needed, and aligning units of measurement.
That way, what you get is clean, ready-to-use, and easy to merge into your existing data systems.
Custom Quality Rules for Different Business Needs
Here’s something a lot of providers miss: data quality isn’t one-size-fits-all.
An e-commerce client tracking competitor pricing might care most about timeliness and accuracy. Meanwhile, a market research firm collecting review data might prioritize completeness and validity (like making sure star ratings and reviewer names are always present and correctly formatted).
That’s why PromptCloud builds in custom quality rules based on what matters most to you. We don’t just deliver generic feeds—we deliver datasets that meet the quality standards you define.
Everything we do— from how we crawl websites to how we package the data—is designed with quality in mind. Not because it looks good in a sales pitch, but because our clients depend on it.
Why Data Quality Metrics Matter (and How PromptCloud Gets It Right)
Data quality metrics aren’t just technical buzzwords—they’re the foundation of every smart business decision. Without accuracy, completeness, consistency, and timeliness, even the most advanced analytics can steer you in the wrong direction.
That’s why it’s not enough to collect data—you need to trust it.
At PromptCloud, we take that responsibility seriously. From tailored web scraping to automated validation and custom quality rules, everything we deliver is built to meet your standards, not just ours.So, if you’re tired of wasting time cleaning messy data or second-guessing your sources, let us help. Ready to see how clean, reliable data can change the game for your business? Get in touch with us or schedule a demo today.