The fashion industry is rapidly evolving and increasingly relying on data to better align itself with consumer preferences, analyze competitors, and improve product strategy. Many boutique agencies are already working on fashion data analysis to cater to the growing demand for data-driven decision making by fashion brands and marketplaces.
This post presents the visualizations created by analyzing web data extracted (via PromptCloud’s in-house crawling solution) from popular fashion retailer Vero Moda™.
The Product Data Set
The data set was created by crawling more than 1.8 million product data from the retail website for the European region. Although there are about 20 different data fields, here are the important ones selected for this analysis:
- Price
- Countries
- Colour
- Product size
- Product title
- In-house brands
Fashion Data Analysis
Read on to explore the charts created by analyzing Vero Moda fashion product data and above-mentioned data fields.
Top In-House Brands
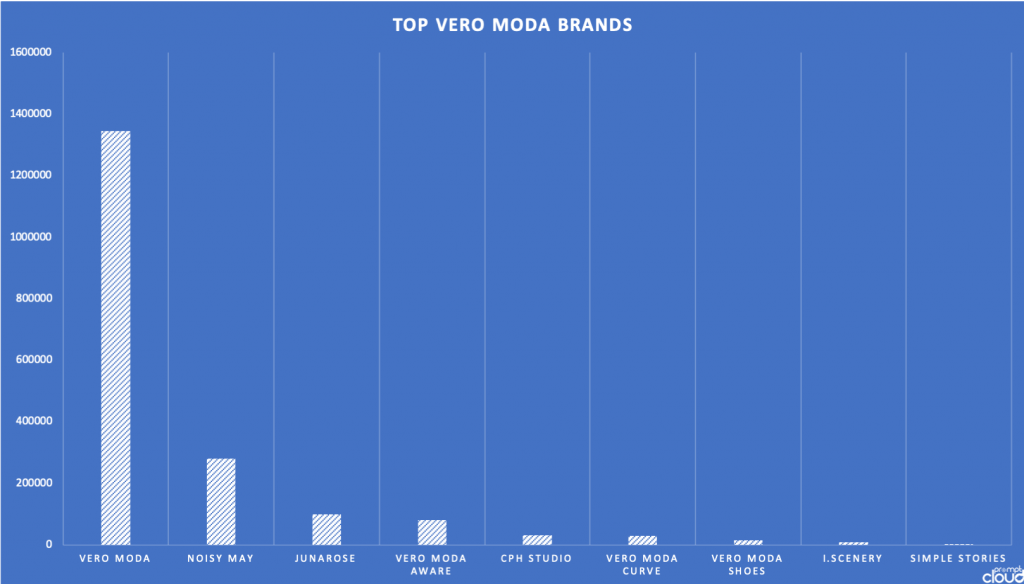
It is a common practice for any retailer to launch separate brands in order to have different product positioning. The following chart shows the other brands under the Vero Moda™ umbrella brand.
We can see that “Noisy May”, “Junarose”, “Vero Moda Aware” are the top three brand variants with the majority of products. Note than Noisy May is positioned as an unconventional jeans-based brand.
Most Popular Colours
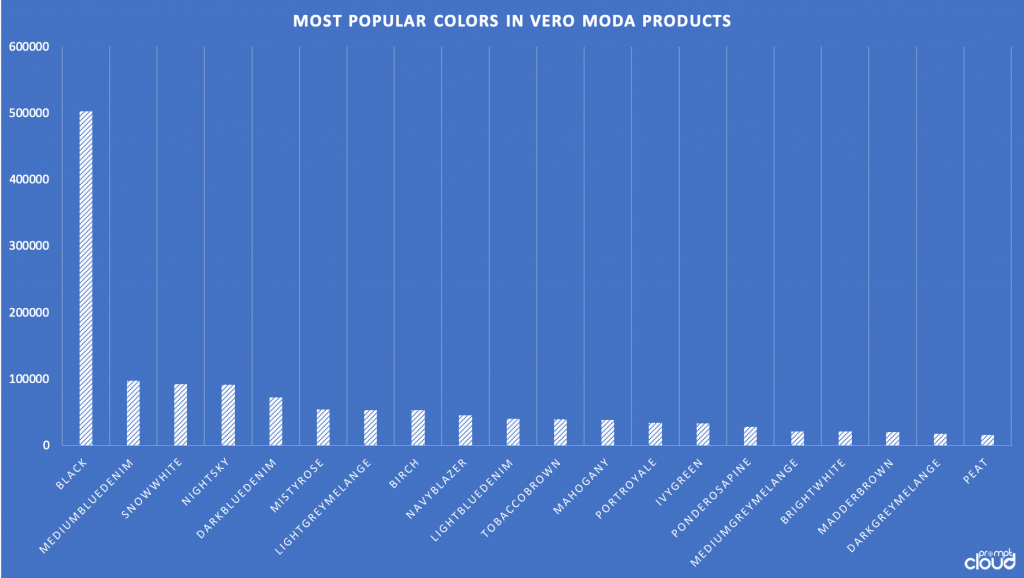
“You can have any colour as long as it’s back” — a famous quote from Henry Ford. And this applies to fashion as well. We see that black colour wins by a huge margin and the other popular colours are “denim”, “white”, “night sky”, and “misty rose”.
Countries with the highest number of products
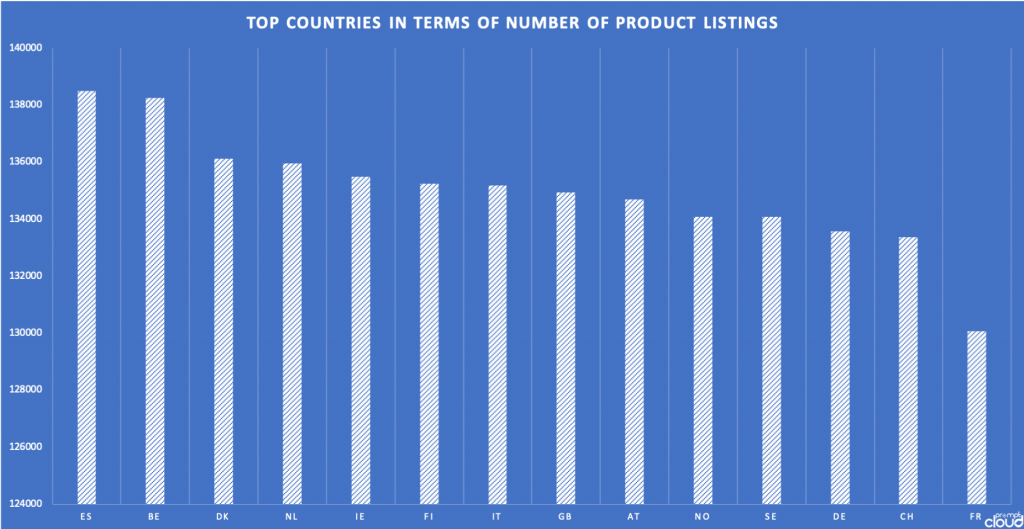
Which of the European nations commands the maximum number of product listings? Based on the data, we see Spain, Belgium, Denmark, Netherlands, and Ireland are the ones with the maximum number of listings.
Surprising to see France which is home to the world’s fashion capital scores the least in terms of the number of product listings.
Fashion Data Analysis for Pricing
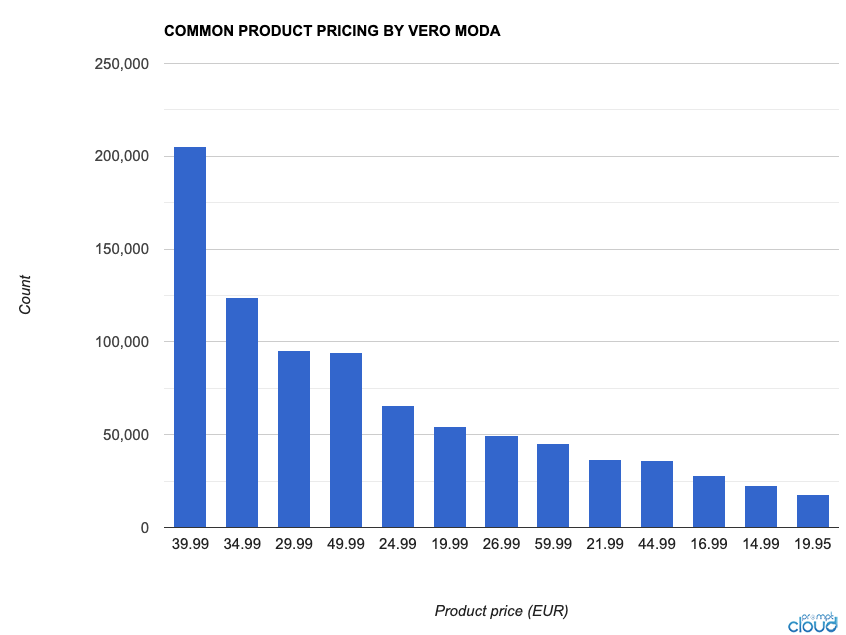
The following chart explores the most common pricing point (in Euro) of fashion products. We see that the majority of the products are less than 50 EURO since the brand falls in the affordable segment and the most common price point is 39.99 Euro.
Common Product Size
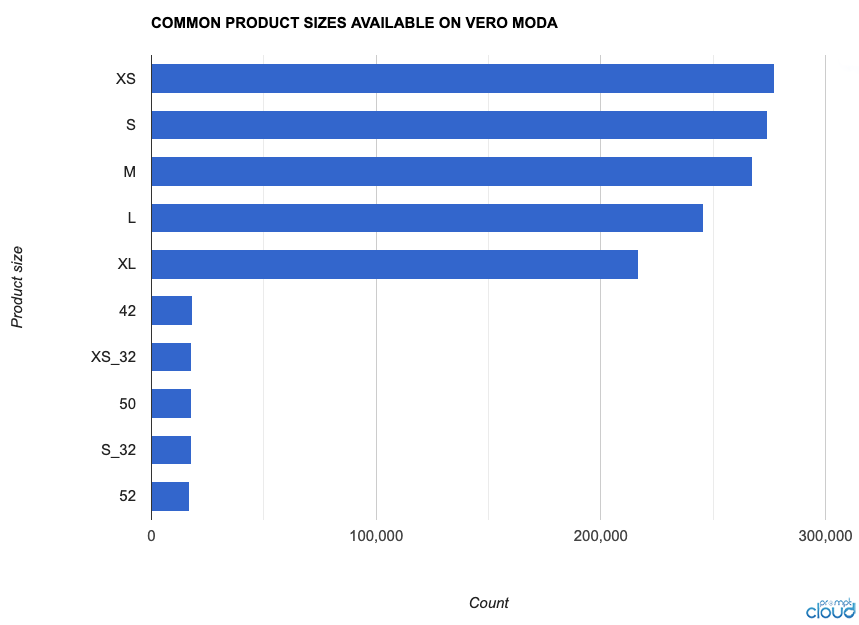
What are the common product sizes sold by the retailer? Let’s answer that by looking at the following chart.
The chart shows that ‘XS’, ‘S’, and ‘M’-size products are predominantly available in comparison to the other sizes.
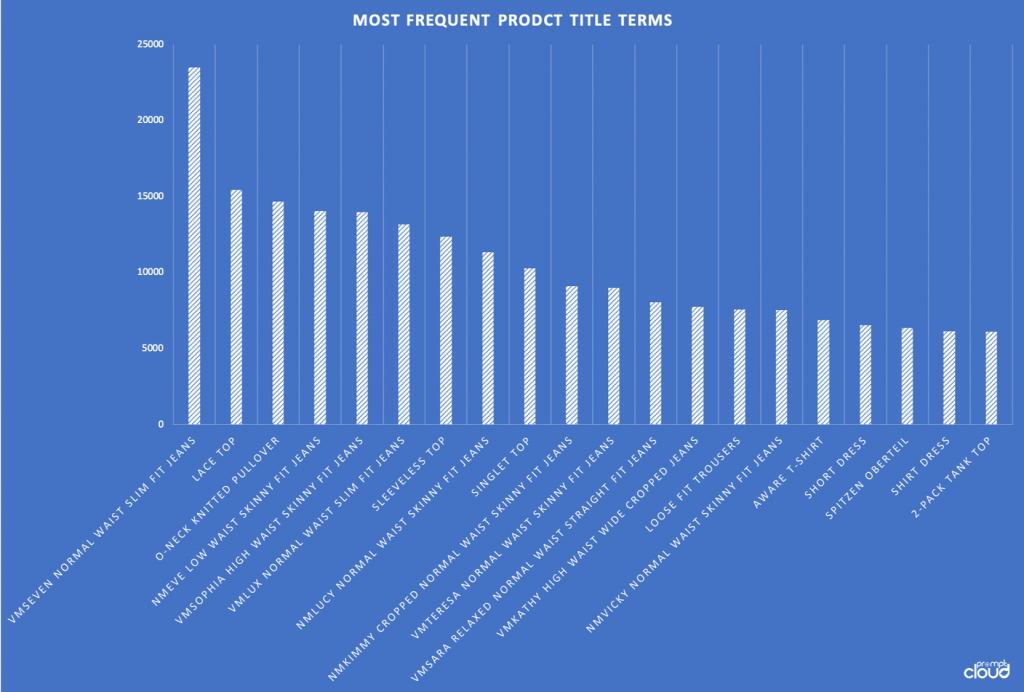
Frequently Used Product Terms
This chart is very interesting since it gives us a sense of what type of products are getting listed the highest which can be co-related with the demand. We see that different types of jeans, tops, and pullovers are the products with the maximum number of listings.
The Conclusion from Fashion Data Analysis
To summarize the analyses, we saw that the most common pricing is 39.99 Euro with black being in the dominating colour. We also saw jeans and tops are the most available fashion products, “Noisy May” as the most popular in-house brand, and smaller sizes are the most common among various product sizes.
Note: This article is purely intended for educational and research purposes. The occurrence of any brand name or website doesn’t directly imply that PromptCloud crawls data from the aforementioned sites.
Are you looking for a web crawling solution to collect data for fashion product analysis. Get started by submitting your requirements here.

