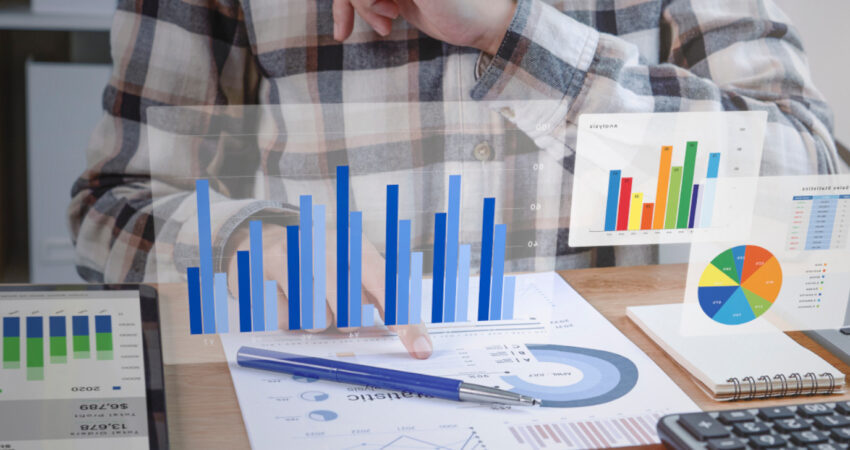
Is Data Visualization can Boost your Brand’s visibility in Fashion Industry?, eCommerce as a platform has an impact on the way people shop. Increasing internet penetration with low pricing structure has enabled the end customer to have access to a variety of products and services, right at the fingertips. The recent covid19 pandemic has accelerated online shopping footfall, with over 90% of the world’s population using the internet. Taking the e-commerce unicorn brand as an example, Shein has doubled its valuation from $15 Billion to $30 Billion in 2021 and has reached $10 Billion in annual sales.
It is evident that eCommerce is on a rise. Everyday more companies are going digital and the competition in the niche markets is rising too. The booming retail businesses are focused on exploring methods to acquire leads and make sense of the trends to increase revenues.
3 ways web data crawling can help: eCommerce edition
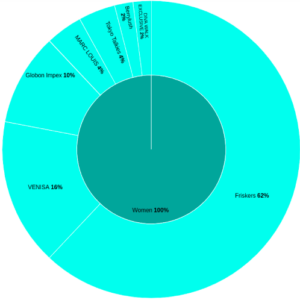
Share of voice: Trending brands
To set a context here, have you noticed that the products appearing in the first few pages in Google or Bing are purchased the most? It is important that the brand stays visible in the category page results, as it improves the product credibility as well. These high ranking products carry a higher probability to get imprinted in the buyers’ mind, which directly impacts brand recall value.
This makes the category index page as one of the prime sources for analyzing content rich information. Let’s Data visualization of the presence of various brands listed in the first page of Myntra with different sort options. We took the comparison of the top two brands in Myntra and analyzed product trends between Marks & Spencer and H&M. Marks and Spencer products capture over 25% of category pages, followed by H&M with 16%. Also, these products are generally rated high. Hence, users perceive these products as high-quality with respect to pricing.
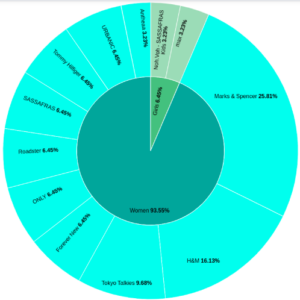
When we change sorting to “Popularity”, the trend shifts to brands like Sassafras, Athena, and H&M. One inference from this Data Visualization implies that H&M products are popular because it has high number of reviews and is rated high by users. Now, each marketplace has their own algorithms to identify popular products, but I believe it’s safe to assume that the sales numbers and the rating of the product carry a significant weightage. So, as a brand, one’s goal and related efforts should be towards appearing on the first page, or at least, the first 5 pages of the category listing page.
What is competitive landscape
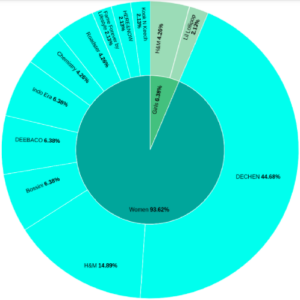
The rise of eCommerce platforms has created opportunities for the new players. When we sort the trend by ‘new’, the competitive landscape analytics reveals that the popular brands like H&M and Bossini are releasing new products and there is an equal opportunity for the newer brands like Dechen and Indo Era, raising to fame by releasing new collections.
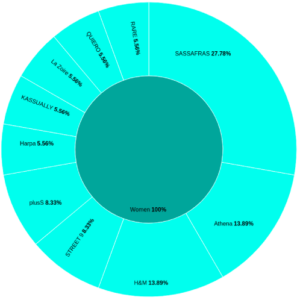
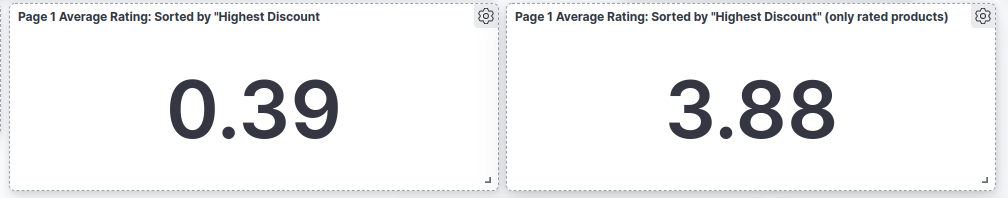
When we sort using discounts, we see a mix of clustered data because most of the listed brands run discounts. But when this data is combined with the average product rating, you’ll notice that the average rating of these discounted products is abysmally low, at 0.39. So it is fair to suggest that either the products with higher discounts are generally rated low or the new products in the market have not been rated yet by the users.
By adding another dimension to this statistic, we can see that it is the latter. The statistic on the right, in the below picture, is the average number of ratings where there is at least 1 rating by the users. Notice how this average jumps to 3.88? This indicates that the products which do not have enough ratings are the ones offering the highest discount.
By adding another dimension to this statistic, we can see that it is the latter. The statistic on the right, in the below picture, is the average number of ratings where there is at least 1 rating by the users. Notice how this average jumps to 3.88? This indicates that the products which do not have enough ratings are the ones offering the highest discount.
How to create a brand perception
To understand Brand Perception, it will be apt to analyze and Data Visualization using the Popularity sort option and relating that information to the average rating at a brand level, for products listed in the first 5 pages to know more about what’s popular and trending.
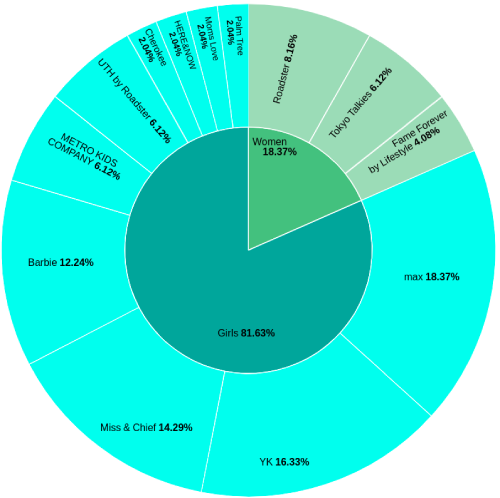
As the bar chart suggests, Sassafras has listings of products with at least 100 ratings where the page number is less than or equal to 5, indicating a popular trend among shoppers. These trends change when sorted with average rating of products, revealing that Sassafras is not listed in the top 15 brands. Since this brand has an average rating of 4.2, it misses the top 15 slots by just a margin. Hence we can safely conclude that this brand occupies the highest screen space and is rated-high.
Things to keep in check: Data analytics solutions
Data insights will help you to make informed business decisions. As the insights can be narrowed down to track various metrics and increase the sales numbers. We have a list of few questions to introspect before deciding on the business direction:
- What kind of brand do you want to be? One offering the highest discounts or being popular?
- How will you ensure highest visibility for listed products?
- Are you ready to design a marketing strategy using demographic information?
- Who are the new players in the categories you operate in?
- Are the new players your direct competitors?
- What are the popular products in the category?
- How can your products become popular?
- Is rating an important metric?
- Are more of my products visible in the first few pages or less?
Having a resource as valuable as data, the opportunities become endless for ensuring profitability and visibility that your brand desires. If you are ready to tap into the resource, contact us to gain access to reliable data. Data Visualization